|
| | |
| | Joseph M. Holsten has served as a director since May 2009, Vice2009. Mr. Holsten is Chair of the BoardSupply Chain and Chair of the OperationsPublic Policy Committee from July 2014 until March 2015, and is a member of the Finance and Audit Committees.Committee. Since November 2011, Mr. Holsten has been Chairman of the Board of LKQ Corporation (“LKQ”), the largest provider in the U.S. of aftermarket, recycled and refurbished collision replacement parts and accessories, and a leading provider of new automotive aftermarket products in the United Kingdom, and the Benelux countries.countries, Italy, Switzerland, the Czech Republic and several other Central European states. He has been a member of the Board of Directors of LKQ since February 1999. Mr. Holsten was the President and Chief Executive Officer of LKQ from November 1998 until January 2011 when he became Co-Chief Executive Officer as part of his transition to retirement. He retired from his position of Co-Chief Executive Officer in January 2012. Prior to joining LKQ, Mr. Holsten held various positions of increasing responsibility with the North American and International operations of Waste Management, Inc. for approximately 17 years. From February 1997 until July 1998, Mr. Holsten served as Executive Vice President and Chief Operating Officer of Waste Management, Inc. From July 1995 until February 1997, he served as Chief Executive Officer of Waste Management International, plc. Prior to working for Waste Management, Inc., Mr. Holsten was a staff auditor at a public accounting firm. Mr. Holsten's operating and strategic experience in the waste industry, in both domestic and international markets, combined with his knowledge of global commodities markets, provides the Board with valuable insight and perspective on industry specific issues. In addition, as a recent chief executive officer and current executive chairman of a public company, Mr. Holsten brings valuable perspective to management on a range of issues, as well as a deep financial expertise and understanding. Mr. Holsten is 6365 years old. |
| | |
| | | |
| | Stephen J. Jones was appointed our President and Chief Executive Officer and elected as a director onin March, 5, 2015. Prior to joining Covanta, Mr. Jones was employed by Air Products and Chemicals, Inc. (“Air Products”), a global supplier of industrial gases, equipment and services from 1992 through September 2014. Mr. Jones served as senior vice president and general manager, Tonnage Gases, Equipment and Energy of Air Products, from April 2009 through September 2014. Mr. Jones also served as Air Products’ China President from June 2011 through September 2014 at Air Products’ office in Shanghai. He was also a member of Air Products’ Corporate Executive Committee from 2007 through September 2014. Mr. Jones joined Air Products in 1992 as an attorney in the Law Group representing various business areas and functions and in 2007 he was appointed senior vice president, general counsel and secretary. Mr. Jones also serves on the Board of Bloomsburg University Foundation. Mr. Jones’ experience managing and growing domestic and international companies, with capital-intensive operating assets, his business acumen and his knowledge of the energy marketplace are valuable assets to the Board. Mr. Jones is 5456 years old. |
| | |
| | | |
| | Anthony J. OrlandoDanielle Pletka served as our President and Chief Executive Officer from October 2004 until March 5, 2015. He has served as a director sincewas appointed to the Board in September, 20052016 and is a member of the FinanceSupply Chain and Public Policy Committee and the Public PolicyNomination and TechnologyGovernance Committee. Ms. Pletka has served as senior vice president of foreign and defense policy studies at the American Enterprise Institute (AEI), a leading public policy research organization, since 2002. Prior to serving as our President and Chief Executive Officer, Mr. Orlando had been President and Chief Executive Officer of Covanta Energy since November 2003. From March 2003 to November 2003, Mr. Orlandojoining AEI, she served as Senior Vice President, Businessa senior professional staff member for the United States Senate Committee on Foreign Relations between 1992 and Financial Management2002, where she specialized in the Near East and South Asia.
Ms. Pletka has extensive experience in international affairs and markets, and in the political climates in many countries. As we seek to expand our business in international markets where opportunities exist, Ms. Pletka's experience, and strategic insights into new markets and the related political climate and outlook in those markets, provide valuable perspective to the Board and management. Ms. Pletka is 54 years old. |
| |
| | |
|
| | |
| | Michael W. Ranger was appointed to the Board in September, 2016 and is the Chair of Covanta Energy. From January 2001 until March 2003,the Audit Committee and a member of the Finance Committee. Since 2004, Mr. OrlandoRanger has served as Covanta Energy's Senior Vice President, Waste-to-Energy. Mr. Orlando joined Covantaco-founder and senior managing director of Diamond Castle Holdings, LLC, a private equity investment firm focusing on energy and power, healthcare, financial services and other diversified industries. Before founding Diamond Castle Holdings in 2004, he was co-chairman of DLJ Global Energy Partners. Previously, he was an investment banker in 1987. As our former chief executive officer with over 25the energy and power sector for 20 years, of experience with the Company, Mr. Orlando has extensive first-hand knowledge and experiencemost recently as head of the energy-from-waste business,Domestic Power Group at Credit-Suisse First Boston from 2000 to 2004 and prior to that as group head of Global Energy & Power at DLJ from 1990 to 2004. Before joining Donaldson, Lufkin & Jenrette, he was a senior vice president in the Company's assets,Energy & Utility Group at Drexel Burnham Lambert and the engineering and technical aspectswas a member of the Company's business, which providesUtility Banking Group at Bankers Trust. Mr. Ranger is a former member of the board of directors of TXU Corp. (Dallas), American Ref-Fuel, Inc, Catamount Energy Corporation, Boston Media Group and Beacon Behavioral Health and is currently on the board of directors at Consolidated Edison, Inc. and KDC Solar, Inc. He is Vice-Chairman of the Board of Trustees of St. Lawrence University, former Chairman of the Board of The Seeing Eye, Inc., and former President of the boards of Morristown-Beard School and of Life Camp, Inc.
Mr. Ranger's extensive experience in investment and finance, including board positions at both public and private companies in the energy-from-waste and broader energy sectors, bring valuable insight and perspective to the Board and management with a greater understanding of all aspects of our business.respect to growth strategies, energy markets, and governance. Mr. OrlandoRanger is 5659 years old. |
| | |
| | | |
|
| | |
| | Robert S. Silberman is Lead Director of the Company and has served as a director since December 2004 and2004. Mr. Silberman is a memberthe Chair of the Compensation CommitteeNominating and the FinanceGovernance Committee. Mr. Silberman has been Executive Chairman of the Board of Directors of Strayer Education, Inc. since May 2013, Chairman of the Board from February 2003 to May 2013 and its Chief Executive Officer from March 2001 until May 2013. Strayer Education, Inc. is an education services company, whose main operating asset, Strayer University, is a leading provider of graduate and undergraduate degree programs focusing on working adults. Mr. Silberman is also a Managing Director at EGI Division. Mr. Silberman is a member of the Council on Foreign Relations, a nonpartisan resource for information and analysis on foreign relations. He also serves as a director of 21st Century Fox and Par Pacific.Pacific Holdings, Inc. From 1995 to 2000, Mr. Silberman held several senior positions, including President and Chief Operating Officer at CalEnergy Company, Inc., an independent energy producer. Mr. Silberman has also held senior positions within the U.S. Department of Defense, including as Assistant Secretary of the Army. Mr. Silberman's positions as a current executive chairman and formerly as a long-tenured chief executive officer and board member of public companies, coupled with his financial background in investing in and growing energy and project development businesses, and his experience at senior positions in the public sector, combine to provide valuable insight and perspective to both the Board and management. Mr. Silberman is 5860 years old. |
| | |
| | | |
| | Jean Smith has served as a director since December 2003 and is Chair of the AuditCompensation Committee and a member of the Nominating and Governance Committee and the CompensationAudit Committee. Ms. Smith is currently Chief Executive Officer of West Knoll Collection, LLC, a custom home furnishings company. From 2009 to 2013, Ms. Smith was a Managing Director of Gordian Group, LLC, an independently owned investment bank. From 2006 through 2008, she served as Managing Director of Plainfield Asset Management LLC, an investment manager for institutions and high net worth individuals. Ms. Smith previously held the position of President of Sure Fit Inc., a home textiles company, from 2004 to 2006 and was a private investor and consultant on various special situation projects from 2001 to 2004. Ms. Smith has more than 30 years of investment and international banking experience, having previously held the position of Managing Director of Corporate Finance for U.S. Bancorp Libra and senior positions with Bankers Trust Company, Citicorp Investment Bank, Security Pacific Merchant Bank and UBS Securities. Ms. Smith brings a range of extensive and diverse financial and business experience to the Board, including in the areas of capital markets, investment management, and operations and business management in both domestic and international markets. Ms. Smith is 6062 years old. |
| | |
| | |
|
| | |
| | |
| | Samuel Zell has served as our Chairman of the Board since September 2005, and had also previously served as a director from 1999 to 2004, as our President and Chief Executive Officer from July 2002 to April 2004 and as our Chairman of the Board from July 2002 to October 2004. Mr. Zell's one-year term as our Chairman and as a director will expire at the next Annual Meeting. Since January 3, 2012, Mr. Zell has served as the Chairman and Chief Executive Officer of the Equity Group Investments division of Chai Trust Company, LLC, a private investment firm he founded over 40 years ago, and prior to that Mr. Zell served as the Chairman of its predecessors for more than the past five years.ago. He also serves as Chairman ofof: Anixter International, Inc., a global distributor of electricalnetwork, security, electric, and cable systems;utility power solutions; Equity Commonwealth, an office building equity real estate investment trust (REIT); that owns and operates office buildings; Equity LifestyleLifeStyle Properties, Inc., an equity REIT primarily engaged in the ownershipthat owns and operation ofoperates manufactured home resort communities;communities, RV resorts and campgrounds; and Equity Residential, an equity REIT that owns and operates multi-family residentialrental apartment properties. Mr. Zell served as the Chairman of the Board of Tribune Company, a Chicago-based media conglomerate, from December 2007 until December 2012 andat which time Tribune Company emerged from Chapter 11 bankruptcy. He served as itsTribune Company’s Chief Executive Officer from December 2007 until December 2009. Mr. Zell previously served as the Chairman of the Board of Equity Office Properties Trust, an equity REIT that owned and operated office buildings, and was the company's Interim President from April 2002 until November 2002 and was its Interim Chief Executive Officer from April 2002 until April 2003. Mr. Zell also previously served as Chairman of the Board of Rewards Network Inc., a dining rewards company and Blackstone Mortgage Trust, Inc. (f/k/a Capital Trust, Inc.), a specialized finance company. |
| | Mr. Zell's financial sophistication, extensive investment and management experience in domestic and global markets, dynamic business and strategic expertise and vast network significantly augment the Board in substantially every aspect of its functionality and provide invaluable insight to management. Mr. Zell is 7476 years old. |
| |
PROPOSAL NO. 2
RATIFICATION OF APPOINTMENT OF INDEPENDENT REGISTERED PUBLIC ACCOUNTING FIRM
The Audit Committee has appointed Ernst & Young LLP as our independent registered public accounting firm to audit our consolidated financial statements for the year ending December 31, 2016,2018, subject to ratification of the appointment by our stockholders. During the 20152017 fiscal year, Ernst & Young LLP served as our independent registered public accounting firm and also provided certain tax and audit-related services. We have been advised by Ernst & Young LLP that neither it nor any of its members has any direct or indirect financial interest in us.
Although we are not required to seek stockholder ratification of this appointment, the Audit Committee and the Board believe it to be sound corporate practice to do so. If the appointment is not ratified, the Audit Committee will investigate the reasons for stockholder rejection and the Audit Committee will reconsider the appointment. Representatives of Ernst & Young LLP are expected to attend the Annual Meeting where they will be available to respond to appropriate questions and, if they desire, to make a statement.
The Audit Committee recommends a vote “FOR” the ratification of the appointment of Ernst & Young LLP as our independent registered public accounting firm for the 20162018 fiscal year. Proxies solicited by the Board will be voted “FOR” the ratification of the appointment of Ernst & Young LLP as our independent registered public accounting firm unless instructions to the contrary are given.
PROPOSAL NO. 3
ADVISORY VOTE TO APPROVE THE COMPENSATION OF OUR NAMED EXECUTIVE OFFICERS
In accordance with the Dodd-Frank Wall Street Reform and Consumer Protection Act of 2010 and Section 14A of the Exchange Act, we are asking our stockholders to vote to approve, on a non-binding, advisory basis, the compensation of our named executive officers as disclosed in this proxy statement. At our last annual meeting, approximately 75% of our stockholders voted “FOR” an advisory vote approving the compensation of our named executive officers.
As described in detail under “Executive Compensation - Compensation Discussion and Analysis” below, the objective of compensation arrangements with our named executive officers is to motivate and reward them for creating long-term stockholder value by effectively operating our existing business and executing our strategic growth initiatives. Our compensation programs are broad-based and do not include either tax reimbursements or perquisites for our executive officers. The compensation structure for named executive officers was designed to ensure that a significant portion of compensation opportunities are “at risk” and directly related to performance metrics reflecting alignment with shareholder value creation, while also rewarding operating performance and financial performance. At the same time, these incentives incorporate structural limits to prevent excessive leverage and risk-taking.
We believe that our executive compensation program reflects our performance and aligns the pay of our executive officers, including our named executive officers, with the long-term interests of our stockholders. For example, our pay-for-performance philosophy was exemplified in 2015 when following disappointing financial results, as determined by our Financial Performance Measures of Adjusted EBITDA and Free Cash Flow, our annual cash incentive plan thresholds were not met, the plan was not funded and no incentive cash payments were made. Further, with the drop in our stock price, previously granted equity awards tied to our relative total stockholder return (“TSR”) failed to vest (at any level) in 2016, 2017 or 2018 and our officers and employees did not realize any benefits.
While it remains a fundamental philosophy and purpose that we align the interests of our stockholders and management and that we pay for performance, it is also essential that we properly incentivize the desired performance and retain our officers and employees. In reviewing the effectiveness of our long-term equity incentive plan, we noted that the prior practice of measuring our relative TSR performance against the Standard and Poor’s Midcap 400 Index, the Dow Jones US Conventional Electricity Index, and the Dow Jones US Waste & Disposal Services Index for our performance-based equity awards was not creating effective incentives and alignment between management and our stockholders and with the advice of our independent compensation consultants, we revised the performance measure utilized for these performance-based equity awards to adopt the critical internal financial performance measure of cumulative Free Cash Flow per share as our performance-based equity metric in 2016 and 2017. Accordingly, as described below in the Compensation Committee’s Compensation Discussion and Analysis, in 2016 and 2017, the financial performance measure of Free Cash Flow was shifted from the annual cash incentive award program and incorporated into the equity compensation arrangements as a replacement for the TSR measure. As a result, performance-based equity awards under the long-term incentive plan in 2016 and 2017 were granted in the form of restricted stock unit awards vesting after a three-year performance period based upon cumulative Free Cash Flow per share over such performance period. Our Compensation Committee viewed this as an effective metric to measure growth and development of the Company’s business and operations as well as to provide an appropriate incentive for us to continue to generate sufficient cash flow to enable us to better support our strategic and financial objectives, including funding growth and development investments and returning capital to our stockholders. Further, the Compensation Committee noted that the potentially large swings in annual Free Cash Flow tend to even out over an extended period of time making it a better long-term measure of financial performance than an annual measure. Therefore, we believe that the long-term incentive compensation opportunities awarded to our named executive officers in 2017 continue to reflect our strong commitment to paying for performance while effectively aligning the interests and incentives of management and our stockholders.
In response to stockholder comments and requests to include a direct connection between our common stock’s performance and the compensation realized by our executive officers, for 2018 equity incentive awards, the Compensation Committee re-introduced the use of an external measure of relative TSR, in combination with the internal financial performance measure of Free Cash Flow per share, into our performance-based equity compensation program. However, rather than measure our cumulative total stockholder return on common stock against the three stock indices we previously utilized, the Compensation Committee determined to compare our TSR performance against the companies that we view as more of our direct peers and which are included and described below in the Compensation Committee’s Compensation Discussion and Analysis.
Our performance in 2017 was not only highlighted by strong operational performance with Adjusted EBITDA, coming in at 99% of target and consistent with the Company’s guidance to the market, but also by significant strategic developments in our business that will benefit our stockholders in the long run. As described in more detail below in “Executive Compensation - Compensation Discussion and Analysis,” we:
successfully completed construction on time and commenced commercial operations at our new “state of the art” Dublin EfW facility, a 600,000 metric ton-per-year, 58 megawatt facility in Dublin, Ireland;
entered into a strategic partnership with Green Investment Group Limited (“GIG”), a subsidiary of Macquarie Group Limited, creating a platform to develop, fund and own EfW projects in the U.K. and Ireland, with an initial combined pipeline of six projects, and to pursue new opportunities for EfW project development or acquisitions;
sold a 50% interest in Dublin to new joint venture at a greater than a 13x EBITDA multiple effectively providing funding for the pipeline of six investments in the joint venture;
obtained €446 million of new project financing for the Dublin project at substantially lower interest rates and upon improved terms and conditions to refinance the existing project debt; and
lowered our interest expense and extended the term of $400 million of indebtedness by refinancing $400 million of 7.25% senior unsecured notes due 2020 with $400 million of 5.875% senior unsecured notes due 2025.
These actions, along with continued organic growth and continuous improvement, put the Company in a strong position for future growth and development. Accordingly, in order to compensate and reward our named executive officers for these strategic accomplishments for the benefit of all stockholders, we continued to move the compensation of our named executive officers toward the market median with an emphasis on performance-based equity compensation arrangements.
In deciding how to vote on this proposal, we urge our stockholders to read the section entitled “Executive Compensation - Compensation Discussion and Analysis” in this proxy statement, which describes in more detail our compensation objectives and elements of our executive compensation program, as well as the “Summary Compensation Table For The Year Ended December 31, 2017” and other related compensation tables and narrative, which provide detailed information on the compensation of our named executive officers.
The vote on this resolution is not intended to address any specific element of compensation; rather, the vote relates to the overall compensation of our named executive officers, as described in this proxy statement in accordance with the compensation disclosure rules of the Securities and Exchange Commission. The vote is advisory, which means that the vote is not binding on the Company, the Board or the Compensation Committee. However, we value the opinions expressed by our stockholders and the Board and the Compensation Committee will take the results of the vote into account in future compensation decisions.
We ask our stockholders to vote on the following resolution at the Annual Meeting:
“RESOLVED, that the Company’s stockholders approve, on an advisory basis, the compensation of the named executive officers, as disclosed in the Company’s Proxy Statement for the 2018 Annual Meeting of Stockholders pursuant to the compensation disclosure rules of the Securities and Exchange Commission, including the Compensation Discussion and Analysis, the Summary Compensation Table For The Year Ended December 31, 2017 and the other related tables and disclosure.”
The Board recommends that you vote “FOR” the approval of the compensation of our named executive officers, as disclosed in this proxy statement. Proxies solicited by the Board will be voted “FOR” the approval of the compensation of our named executive officers unless instructions to the contrary are given.
EXECUTIVE COMPENSATION
Compensation Discussion and Analysis
Executive Summary and Overview
The following Compensation Discussion and Analysis (“CD&A”) should be read in conjunction with the compensation tables beginning on page 37.38. This CD&A details the decisions regarding our compensation programs and practices as they relate to our named executive officers, who in 20152017 were as follows:
•Stephen J. Jones, President and Chief Executive Officer (as of March 5, 2015)
•Bradford J. Helgeson, Executive Vice President and Chief Financial Officer
•Timothy J. Simpson, Executive Vice President, General Counsel and Secretary
•Michael J. de Castro, Executive Vice President, Supply Chain (as of July 13, 2015)*
•Derek W. Veenhof, Executive Vice President, Sustainable Solutions
Matthew R. Mulcahy, Senior Vice President, Head of Corporate Development
Anthony J. Orlando, former President and Chief Executive Officer (through March 5, 2015)
Seth Myones, former Executive Vice President and Chief Operating Officer (through April 30, 2015)
* While one of the Company's most senior executive officers, Mr. de Castro was not among the three highest paid executive officers other than the Chief Executive Officer or the Chief Financial Officer due to his employment for less than half of 2015. Mr. de Castro has been included in this discussion consistent with the Company's view that Mr. de Castro is one of the Company's most senior executive officers and the importance of his continuing role with the Company.Asset Management
Executive Summary
We are one of the world’s largest owners and operators of infrastructure for the conversion of waste to energy (known as “energy-from-waste” or “EfW”), as well as other waste treatment, metals recyclingdisposal and renewable energy production businesses. Energy-from-wasteEfW serves two key markets as both a sustainable waste management solution that is environmentally superior to landfilling and as a source of clean energy that reduces overall greenhouse gas emissions and is also considered renewable under the laws of many states and under federal law. Our facilities are critical infrastructure assets that allow our customers, which are principally municipal entities, to provide an essential public service. Maintaining thisour reputation and continuing to position ourselves for future success requires high-caliber talent to protect and grow our business in support of our goal of producing superior financial returns for our stockholders.
We designed our executive compensation program with the following goals:
to align the interests of our stockholders and management by putting a significant portion of potential compensation “at risk” and tied to actual performance. Greater relative percentages of potential compensation are at risk for the most senior officers to reflect their respective areas and levels of responsibility for our performance;
to provide a market competitive and internally equitable compensation and benefits package that reflects individual and company performance, job responsibilities and the strategic value of our market position and reputation;
to motivate and reward our senior management team for maintaining and creating long-term value by effectively operating our existing business and executing our strategic initiatives; and
to ensure retention, engagement, and motivation of our senior management team as productive long-term employees, who lead our strategic initiatives, effectively manage our businesses and related risks and drive financial performance.
Many of our named executive officers are longstanding members of our management team or have extensive experience in the waste management and process industries. As a result, our named executive officers are especially knowledgeable about our business and our industry and thus particularly valuable to us and our stockholders as we continue to navigate challenging and dynamic market, economic and regulatory environments.
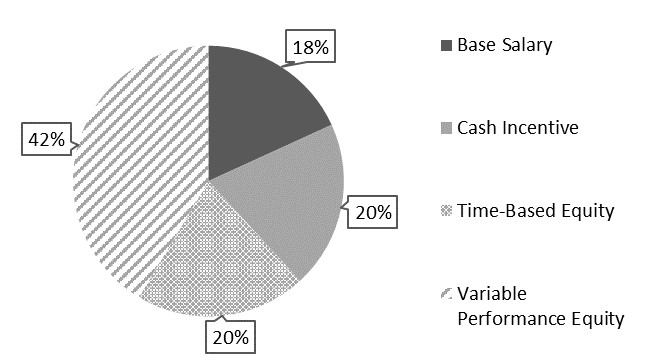
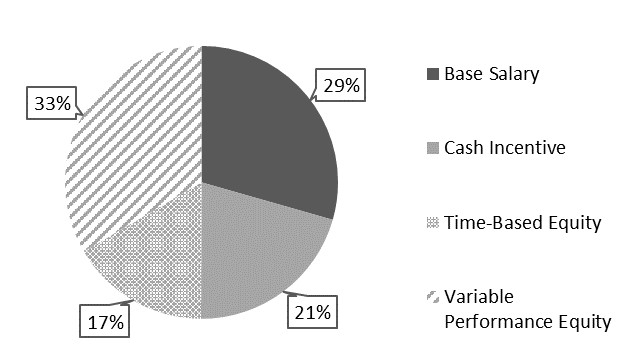
As set forth in the chart below, a significant percentage of the total compensation payableopportunity in 20152017 to the Chief Executive Officer and the other named executive officers as a group was at risk and subject to the performance of the individual officer and the Company:
Chief Executive Officer
At Target - 20152017
Other Named Executive Officers
At Target -2017
We continue to promote a “pay-for-performance” philosophy in compensation and our actions have been consistent with this philosophy. When performance in 2015

While “pay-for-performance” remains a fundamental and essential underlying philosophy in determining compensation for our stocknamed executive officers, we must also structure our compensation arrangements to provide appropriate incentives to drive performance trailed the marketand retain our key employees and we conducted a comprehensive review with our compensation consultants to ensure our compensation plans remained consistent with our philosophy while better achieving these goals. Accordingly, we made series of adjustments, including updating our peer group in 2015, the effectiveness2017 to be more reflective of our current business model by reducing the prior concentration on utilities and including a more diversified group of publicly-held companies that more closely resemble our size and current business. The 15 companies comprising our new customized group are in the following sub-industries: Environmental & Facilities Services; Steel; Renewable Electricity; Independent Power Producers & Energy Traders; Specialty Chemicals; Heavy Electrical Equipment; Semiconductors; and Electric Utilities. We also modified our annual cash incentive and performance equity award programs beginning in 2016 to better support our strategic and financial objectives in order to re-establish an effective alignment between our compensation program and stockholders was evidenced byour stockholders. As a result, in 2016 and 2017 we tied our annual cash incentive bonuses 100% to Adjusted EBITDA and moved the lower realizedFree Cash Flow financial performance measure component, which is subject to significant annual swings due to working capital changes, to our long-term “Performance Equity Awards” to effectively incentivize and current values for 2015retain management. The Performance Equity Awards granted in 2016 and 2017, which comprised two-thirds of each executive officer’s target long-term incentive opportunity, were tied to cumulative Free Cash Flow per share, measured over a three year period.
Further, in response to investors expressed desire to tie equity incentive compensation comparedto a relative TSR metric, in 2018 we will re-introduce a TSR Equity Award utilizing more commonly accepted metrics and tied to the targeted values,relative TSR of our new customized peer group of 15 companies. See, “2018 Compensation Arrangements” below.
Performance remained strong in 2017 with no cash incentive awards being paidbonuses at 97% of target on average. Building upon the successful construction and performance equity awards grantedcommencement of operations at our state of the art EfW facility in 2013 not vestingDublin, Ireland, we agreed to enter into a new joint venture with Green Investment Group Limited (“GIG”) to significantly expand our EfW business in March 2016 duethe United Kingdom and European Union. A fundamental part of this strategic partnership involved the sale of a 50% interest in our Dublin EfW facility to the significant declinejoint venture, in a transaction that closed in February 2018, which effectively funded our initial investment needs for the Company’s stock price in 2015.partnership’s six existing development projects. At the same time we retained full operational control of the Dublin EfW facility under an operations and management contract.
Consistent with our corporate objectives, our compensation programs are broadly-based and equitable, with approximately 350 employees participating in the Long-Term Incentive Plan, ranging from certain Managers, Engineers and Supervisors to the Chief Executive Officer. In addition, our programs support high standards of corporate governance. None of our officers have an employment agreement, nor are they entitled to receive tax reimbursements or gross ups. We maintain meaningful stock ownership guidelines for officers and non-employee directors, and our insider trading policy prohibits all employees, including officers and directors, from trading in derivatives or otherwise hedging the economic risk associated with our common stock.
20152017 Performance Highlights
OurWith improved metals prices, continued organic growth and strong EfW and profiled waste markets throughout 2017 offsetting lower energy prices, our financial performance reflected in our reported Adjusted EBITDA was in-line with guidance ranges and market expectations, even after taking into account the lost revenue resulting from a fire at our Fairfax EfW facility in February, 2017 that shutdown operations until December, 2017. Adjusted EBITDA reported by the Company in 2017 of $408 million was essentially unchanged from Adjusted EBITDA of $410 million in 2016, but with the loss of over 10 months of revenues from our Fairfax County facility, Free Cash Flow anddropped from $176 million to $132 million. Adjusted EBITDA fell significantly below our expectations primarily as a result of material declines in energy and metals prices and losses associated with the construction of the Durham York facility. Adjusted EBITDA declined to $428 million in 2015 from $474 million in 2014 and Free Cash Flow declined to $147 million in 2015 from $240 million in 2014. Free Cash Flow and Adjusted EBITDA are each non-GAAP financial measures, and are not intended as a substitute for other GAAP measures. Both Free Cash Flow and Adjusted EBITDA are used in our compensation programs and are presented in order to show the correlation between these financial measures and compensation to our named executive officers. We also use Free Cash Flow to assess and evaluate the overall performance of the Company’s business and to highlight trends in our overall business and we use Adjusted EBITDA to provide a more complete understanding of our business. For a reconciliation of Adjusted EBITDA and Free Cash Flow to the measures we believe to be the most directly comparable to those measures under GAAP, please see “Item“Item 7. Management’s Discussion and Analysis of Financial Condition and Results of Operations-Results of Operations-Supplementary Financial Information-Adjusted EBITDA (Non-GAAP Discussion)” and “Item“Item 7. Management’s Discussion and Analysis of Financial Condition and Results of Operations-Liquidity-Supplementary Financial Information-Free Cash Flow (Non-GAAP Discussion)” in our Annual Report on Form 10-K for the year ended December 31, 2015.2017.
While our 2015 Free Cash Flow and Adjusted EBITDA performance did not meet our expectations, we didWe also successfully implementaccomplished a variety of strategic objectives in 2017, which included the following:
continued to meetcompleted construction milestoneson time and pursued arrangements to secure future waste stream for our newcommenced commercial operations at the Dublin EfW facility, a 600,000 metric ton per-year,ton-per-year, 58 megawatt EfW facility in Dublin, Ireland;
agreed to strategic partnership with GIG, a subsidiary of Macquarie Group Limited, to develop, fund and own EfW projects in the U.K. and Ireland through a common platform, with an initial combined pipeline of six projects, and to pursue new opportunities for EfW project development or acquisitions;
agreed to sell a 50% interest in the Dublin project to the joint venture with GIG at greater than a 13x EBITDA multiple, effectively funding our pipeline of investments in the partnership;
obtained €446 million of project financing at substantially lower interest rates and upon improved terms and conditions to refinance the existing 2014 Dublin EfW facility project debt with (i) €396 million of senior secured project debt and (ii) a €50 million second lien term loan, and repaid (i) the €250 million Dublin senior term loan due 2021, (ii) the €58 million (original €50 million) Dublin junior term loan due 2022, and (iii) the Dublin convertible preferred stock (original €75 million);
extended long-term service agreements with twoat three of our EfW facilities;
organically grew through a 24% increaseadded three environmental services businesses to our Covanta Environmental Services (“CES”) business, which will further expand our presence in ourthis sector and allow us to direct additional non-hazardous profiled waste business,volumes into our EfW facilities and expanded our CES capabilities, including an expansionclient service offerings and geographic reach;
continued the growth of our special wasteCES offerings and bundled services;customer base with total revenues growing more than 15% year over year;
installed and/or upgraded metal recovery systemslowered our interest expense and extended the term of $400 million of indebtedness by refinancing $400 million of 7.25% senior unsecured notes due 2020 with $400 million of 5.875% senior unsecured notes due 2025;
began utilizing our regional metals processing facility, located in Pennsylvania, to process non-ferrous metals recovered at severalour EfW facilities, constructedcreating higher-value recycled metal products and expanding our potential end markets;
expanded our materials processing capabilities at our Milwaukee CES facility and began operating a regional ferrousmaterials processing systemfacility in Fairless Hills, Pennsylvania, increasing recovery of ferrous and non-ferrous metal by approximately 8% and 12%, respectively;Indianapolis;
commenced operations under our new long-term waste transportation and disposal contract with New York City and commenced waste deliveries on our newly-completed rail line to our Niagara facility as part of our service offering to New York City;
acquired four additional businesses located in Wisconsin, Ohio, Pennsylvania and Iowa, specializing in the treatment, storage and disposal of industrial waste and industrial site / facility remediation projects; and
continued to improveimproved process efficiency and reducereduced ongoing expenses across our business.business through our continuous improvement initiative utilizing Lean Six Sigma methodologies; and
21issued our fourth comprehensive Corporate Sustainability Report in which we outlined our performance to date against a series of sustainability goals aligned with our business goals and mission.
20152017 Compensation Highlights
Compensation Components
In order to create economic incentives to successfully implement our strategic and organic growth objectives, compensation for the named executive officers in 20152017 consisted of the following components:
|
| | | |
| Component | Description/Purpose | How Amount Determined/ Performance Considerations | 20152017 Actions |
Annual Base Annual Salary | Attract and retain experienced executives by providing competitive foundational cash compensation. | Targeted at peer group median with adjustment based upon nature and levels of responsibility, experience and individual performance. | Base salaries for the continuing named executive officers increased by 3.9%10.9% on average in 2015 after several years with no increases and strong financial performance in 2014.2017 to continue to bring compensation levels closer to our peer group median. |
| Annual Cash Incentives | Variable cash incentive to reward achievement of annual financial and strategic goals. | 67% basedBased 100% upon Financial Performance Measures of Adjusted EBITDA and Free Cash Flow and 33% based upon achievement of strategic goals applicable, with Committee discretion to each named executive officer.adjust the earned award up or down. Minimum goals for the Financial Performance MeasuresAdjusted EBITDA must be achieved for any bonus to be funded. | Actual Adjusted EBITDA, and Free Cash Flowas adjusted, performance in 2015 were both below the minimum levels resulting in no funding2017 of a cash bonus pool and no cash bonus payments despite achievement$420.4 million was equal to 99% of many strategic goals.target EBITDA, which funded at 97% of target.
|
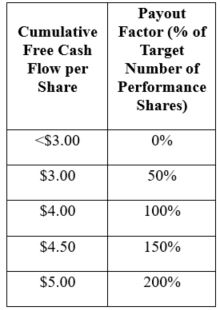
| Performance Based Equity Awards | Variable equity-based awards, with vesting directly tied to relative stockholder returncumulative Free Cash Flow per share performance as measured againstover a three year period. Encourages current decisions that generate free cash flow to operate our business and sustain our dividend, promote long-term value creation for stockholders, and align the named executive officers’ interests with stockholders. | TSRPerformance Equity Awards granted in 2017 will vest three years after grant based upon our relative TSR performance,cumulative Free Cash Flow per share, with vesting at 100% of target at the 70th percentile compared to the TSR performance$4.00 according to the following table: | In March 2015,2017, the Committee granted 67% of target equity-based long-term incentives for the named executive officers (other than Mr. de Castro) in the form of TSR Awards. |
| indexesPerformance Equity Awards tied to cumulative Free Cash Flow per share over a three-year period.
Encourages current decisions that promote long-term value creation for stockholders, and aligns the named executive officers’ interests with stockholders.
| | |
|
| Payouts are linearly interpolated for performance between breakpoints.
Designated market indices are (1) U.S. Dow Jones Waste & Disposal Services Index (25% weighted), (2) U.S. Dow Jones Conventional Electricity Index (25% weighted) and (3) Standard & Poor’s Mid-Cap 400 Index (50% weighted).
As a result of the declinesoftness in our stock price in 2015, TSR Awardsrelative to the three applicable indices, combined with the higher than standard market thresholds for vesting, TSR-based equity performance awards granted in 20132015 did not result in any shares vesting in March 2016.2018.
|
|
*Payouts are linearly interpolated for performance between breakpoints.
|
| Restricted Stock Equity Awards | Shares of restricted stock that vest pro ratapro-rata over a three-yearthree year period and pay dividends. Encourages retention of key talent and aligns the named executive officers’ interests with stockholders. | Shares vest pro rata, upon continued employment, on each anniversary date with actual value determined by stockholder returns during vesting period. | In March 2015,2017, the Committee granted 33% of target equity-based long-term incentives for the named executive officers (other than Mr. de Castro) in the form of restricted stock vesting pro rata over a period of three years based upon continued employment.
|
Compensation Philosophy and Objectives
The Compensation Committee believes that a significant portion of annual and long-term compensation paid to our named executive officers should be closely aligned with our operating and financial performance on both a short-term and long-term basis. The goal of our executive compensation programs is to provide our executive officers with compensation and benefits that are fair, reasonable and competitive in the marketplace. These programs are intended to help us attract and retain qualified executives and to provide rewards that are linked to performance and risk management while also aligning the interests of these individuals with those of our stockholders.
Our incentive programs are generally broad-based. While providing specifically tailored incentives for our senior leadership team, we have also retained our philosophy that in order to provide incentives across the organization, our benefits programs must be broadly available to our officers and management-level employees. Accordingly, approximately 350 employees, ranging from certain managers, engineers and supervisors in our facilities to our senior officers, participate in our long-term incentive plan and receive equity-based awards.
Following the succession of our chief executive officer after more than a decade of service, the Compensation Committee and management examined different approaches to our incentive compensation programs to incentivize growth while prudently managing risk and maintaining an alignment of interests between our stockholders and management. These changes are discussed below under 2016 Compensation Arrangements.
The Compensation Committee has the following objectives in designing the programs:
Performance
The compensation and benefits we offerprovided to our named executive officers arein 2017 were structured to ensure that a significant portion of compensation opportunities isare directly related to (a) our operating performance as reflected in our financial performance and the achievement of strategic objectives, including growth opportunities and enterprise risk management efforts that directly and indirectly enhance, preserve or positively influence stockholder value. Incentive compensation awards have been based in part on (1) company financial measuresAdjusted EBITDA, which we refer to as the “Financial Performance Measures,” and on (2) individual performance executing our strategic objectives.
The Financial Performance Measures for 2015, asis used in our cash incentive program consisted of Free Cash Flow and Adjusted EBITDA for all eligible corporate officers and employees, including all named executive officers.officers, (b) our financial performance over a multi-year period as reflected in our three-year cumulative Free Cash Flow per share, which is used in our Performance Equity Awards, and (c) our absolute total stockholder return, which impacts the earned value of equity compensation.
The Compensation Committee also considers individual performance component of 2015 cash incentivein exercising its discretion to determine target pay opportunities and award compensation was based on our performance and eachto named executive officer’s contributions as they related to executing our business strategy in the following major categories: (1) New Business and Development; (2) Organic Growth in waste and metals; and (3) Strategic Business Goals and Risk Management.officers.
Alignment
In order to align the interests of our named executive officers with our stockholders, a significant componentportion of total target compensation each year is in the form of equity awards. Alignment withawards (e.g., in 2017 62% for our stockholders is further enhanced by aspects ofChief Executive Officer and 50% on average for our program which assure that ourother named executive officers realizeofficers) and a substantial majority of total target annual compensation only to the extent that the Company realizes value through significant performance based equity awards. For example, we align the interests ofis performance-based (e.g., in 2017 82% for our Chief Executive Officer and 71% on average for our other named executive officers and our stockholders through the issuance of performance based equity awards tied to our three-year TSR relative to the weighted performance of the companies in the following three indices: (1) U.S. Dow Jones Waste & Disposal Services Index (25% weighted), (2) U.S. Dow Jones Conventional Electricity Index (25% weighted) and (3) Standard & Poor’s Mid-Cap 400 Index (50% weighted) (the “TSR Equity Awards”)officers). (See “Long-Term Equity Awards - TSR Equity Awards - Performance and Vesting Criteria” for more detail). Our TSR Equity Awards were designed with vesting thresholds at significantly higher levels than similar awards at the other companies in our peer group in order to create incentives for strong relative performance and to assure alignment with the interests of our stockholders.
We also have had robust stock ownership guidelines for our officers, including our named executive officers. These guidelines create structural and objective means of assuring ownership and retention of shares of our common stock in value equal to a specified multiple of each officer’s base salary, increasing with levels of responsibility.
Retention
To promote retention of key talent, one-third of equity grants in 20152017 were in the form of restricted stock awards earned on a pro rata basis over a period of three years, with vesting generally conditioned upon the employee’s continued employment with us on each vesting date. Further, TSRPerformance Equity Awards only vestedvest after a period of three years, based upon our TSRcumulative Free Cash Flow per share performance, relative to certain peer groups, which also promotedpromotes retention.
Competitiveness and Benchmarking
We offer total compensation packages at levels we believe are required to attract and retain qualified employees and officers, including named executive officers. In assessing appropriate levels of total compensation and benefits, the Compensation Committee uses a variety of benchmarking techniques and generally has compared our compensation levels to a market median. With advice from its compensation consultants (described more fully below), the Compensation Committee developedAs a “peer group” of similarly-sized companies in comparable industries for inclusion in competitive benchmarking analyses. For 2015, in connection with reviewing the compensation levels and conducting a benchmark analysisresult of the named executive officers' compensation,change in our business profile over the Compensation Committee used a peer group of companies in the businesses of waste, environmentalpast several years and facilities services, independent power producers, renewable energy and electric utilities that had comparable revenues and/or market capitalizations.
The 2015 peer group was substantially similar to prior years, with the addition of Schnitzer Steel, a metals recycling company, to our peer group to reflect the expansion of our metals recycling and recovery efforts and other profiled waste solutions, as well as merger and acquisitions activity among the removalpeer companies, the Compensation Committee, with the assistance of UNS Energy Corporation due to its acquisition. The 2015independent compensation consultants and management, re-evaluated our peer group consistedcomposition to reflect more appropriately our business mix and company size and developed a new customized peer group.
Customized Peer Group
As our business profile has evolved over time, the Compensation Committee has continued to re-evaluate our peer group composition. With the expansion of and growth of our (i) processing of profiled wastes and implementing comprehensive waste solutions for customers through CES with revenues of approximately $206.5 million in 2017 from less than $80 million in 2014, (ii) metals recovery and recycling business with volumes recovered increasing each year, and (iii) sales of energy into the following companies:spot markets and hedging arrangements instead of under long-term power purchase agreements, the Compensation Committee, with the advice of its independent compensation consultants, created a new customized peer group for 2017 that reduced the prior concentration on utilities and included a more diversified group of publicly-held companies that more closely resemble our size and current business with the goal of placing the Company towards the median in terms of revenue, EBITDA, net income and market capitalization.
Accordingly, the new peer group adopted by the Compensation Committee beginning in 2017 was composed of 15 companies with (i) median annual revenues as of December 31, 2017 of $2,306 million (Covanta $1,752 million); (ii) median annual EBITDA
of $323 million (Covanta $280 million); (iii) median annual net income of $64 million (Covanta $57 million); (iv) median annual EBITDA margin of 14.8% (Covanta 16.0%); and (v) median market capitalization of $3,086 million (Covanta $2,208 million). The following table identifies the peer group companies along with their respective GICS sub-industry classifications:
|
| | |
Avista Corporation | NRG Energy, Inc. | Vectren Corporation |
Black Hills Corporation | PNM Resources, Inc. | | GICS |
| Company | | Sub-Industry |
| ALLETE | | Electric Utilities |
| Babcock & Wilcox | | Heavy Electrical Equipment |
| Calpine Corp. | | Indep. Power Prod. & Energy Traders |
Casella Waste Connections Inc. | | Environmental & Facilities Services |
Clean Harbors Inc. | Portland General Electric Company | Westar Energy, Inc.Environmental & Facilities Services |
Cleco CorporationCommercial Metals | Progressive Waste Solutions, Ltd. | UIL Holdings CorporationSteel |
Hawaiian First Solar | | Semiconductors |
| HB Fuller | | Specialty Chemicals |
| Ormat Technologies | | Renewable Electricity |
| PNM Resources | | Electric Industries, Inc.Utilities |
| Schnitzer Steel | | Steel |
IDACORP, Inc. | Tetra Tech Inc.Sims Metal Mgmt | | Steel |
| Stericycle | | Environmental & Facilities Services |
| US Ecology | | Environmental & Facilities Services |
| Waste Connections | | Environmental & Facilities Services |
| Covanta | | Environmental & Facilities Services |
As our business profile changes over time, the Compensation Committee will continue1 Peer group company median financial data derived from Standard & Poor’s Capital IQ and reflect adjustments by Standard & Poor’s intended to evaluate our peer group composition to reflect appropriately our business mix and company sizestandardize information across companies. These adjustments may result in differences versus publicly reported financials as well as to adjust for mergers and acquisitions.calculated in accordance with GAAP.
Role of Compensation Consultants
The Compensation Committee has periodically engaged independent compensation advisors at FW Cook to provide assistance and advice in carrying out its duties, which advisors are currently atduties. Advisors from Frederic W. Cook & Co. (“Cook & Co.”, Inc. ("FW Cook"). Advisors from Cook & Co., upon request by the Compensation Committee, have provided independent compensation advice on various aspects of executive compensation, including the compensation payable to our executive officers and directors, reviewing compensation structures and recommendations presented by management, reviewing our peer group and other compensation matters. FW Cook & Co. advisers took their direction solely from, and provided their reports solely to, the Compensation Committee. Billing by FW Cook & Co. was provided directly to, and approved for payment by, the Compensation Committee.
The current relationship with FW Cook & Co. is exclusive to the Compensation Committee and is consistent with formal written procedures to maintain the independence of this relationship. At the request of the Compensation Committee, FW Cook & Co. addressed and confirmed their independence in writing to the Compensation Committee.
Use of Consultants in Analysis of 20152017 Compensation Program
At the request of the Compensation Committee, FW Cook & Co. assisted the Compensation Committee in (i) evaluating and updating the Corporation’sCompany’s customized peer group; (ii) providing a benchmark of compensation practices and levels against the Corporation’sCompany’s customized peer group to assist the Committee in its evaluation of compensation for our named executive officers; (iii) conducting an independent and objective review of market and best practices on severance arrangements, in both the change in control and non-change in control settings, retirement programs and continuation of benefits; and (iv)(iii) reviewing proposals for future incentive compensation program design, including metrics to best align the interests of management and the stockholders. Cook & Co. also assisted and advised the Compensation Committee regarding possible approaches to address challenges associated with commodity price volatility in connection with the Corporation’s annual cash incentive program.
The Annual Compensation Process
Our annual compensation review is undertaken at the direction and under the supervision of the Compensation Committee. Other than our Chief Executive Officer working with our Chief Financial Officer and Chief Human Resources Officer, no executive officers are involved in making recommendations for executive officer compensation. No officers are involved in determining director compensation. Following the review process, the Compensation Committee discusses the review process and compensation determinations with the non-management members of the Board, and approves the annual base salary, equity award grants, incentive cash award targets and financial metrics for the upcoming year and incentive cash awards for the prior year for the named executive officers.
Specifically, the Compensation Committee approves:
•the targets for the Financial Performance MeasuresAdjusted EBITDA for the performance portioncriteria of the annual cash incentive awards;
the performance towards strategic objectives set the prior year and the allocation of the annual cash incentive awards based upon the relative individual performance of the named executive officers in the areas of their responsibility towards such strategic objectives;
•the form and amount or dollar value of equity awards; and
•the vesting criteria, including any performance-based criteria, and vesting dates for equity awards.
In the first quarter of each year, typically in February, the Compensation Committee reviews management’s recommendations and our historical pay and performance information. The Compensation Committee’s review includes approval of the value of restricted stock and performance based equity award grants. It is generally the Compensation Committee’s policy to authorize and grant equity awards as of the date of the Board of Directors meeting at which such awards are ratified by the non-management members of the Board of Directors upon the recommendation of the Compensation Committee, based upon the closing price of our common stock on the date of the award.
Periodically throughout the year, the Compensation Committee may discuss, as appropriate, the philosophy for the overall compensation program, and decide whether changes should be made in particular program components or whether special awards are appropriate or desirable during the current year or for future periods.
In 2015,2017, the Compensation Committee used analysis of historic awards and tally sheets to assist in analyzing the named executive officers’ total compensation and various elements of their compensation and benefits, as well as potential payments in the event of a change in control. The tally sheets provided an additional macro level data point and long-term “check and balance” to the compensation process, which is typically more focused on the micro level and annual aspects of the individual components of compensation. The tally sheets also provided the Compensation Committee with information regarding the value of unvested outstanding equity awards for retention purposes and the wealth accumulation of our executive officers in the form of cumulative equity awards, the value of realized and unrealized awards and then current equity holdings. The Compensation Committee also examined equity wealth accumulation through its review of the named executive officers’ compliance with their respective stock ownership guidelines.
Although theThe Compensation Committee hasretains the authority to increase or decrease compensation based upon its review of tally sheets, itand did not change anynote the impact of unrealized awards on overall compensation based upon its review of tally sheetsand accumulated wealth in 2015.2017.
Overview of 20152017 Compensation Structure
In order to align the interests of management and stockholders, the components of compensation for our named executive officers are focused on measurable, objective financial performance measures that are important to our stockholders. Adjusted EBITDA, which the Company uses to assess short-term profitability, cost control and growth, was used as the sole financial performance measure used for awards under our annual cash incentive program and cumulative Free Cash Flow per share, which the Company uses to assess the Company’s ability to continue to generate sufficient cash flow to enable the Company to sustain its practice of returning capital to its stockholders, but which is better viewed over a longer term period due to its large year-over-year swings resulting from timing differences in working capital, was used as the sole financial performance measure over a three year period to determine vesting under our Performance Equity Awards. Although individual strategic performance goals were not used as a specific component of compensation, the Compensation Committee continued to evaluate strategic performance accomplishments and retained discretion to adjust earned bonus amounts and/or long-term incentive grant values to recognize the benefits to the Company of individual performance. Further, in order to mitigate the impact of severe volatility, both positive and negative, in commodity prices variances, a floor and ceiling on commodity prices was imputed into the Adjusted EBITDA calculation to adjust commodities produced and sold during the year based on the commodity price levels anticipated at the time the target level of Adjusted EBITDA was set. Actual commodity prices during 2017 were between the floor and ceiling such that no related adjustments were made to Adjusted EBITDA.
Along with the introduction of a customized peer group that was viewed as more representative of our business and more reflective of the competitive pressure for hiring and retaining key employees, certain adjustments were made to 2017 compensation levels of our named executive officers consistent with our philosophy of targeting the median level of compensation within our peer group.
Components of Total Compensation
Our compensation and benefits package for named executive officers consists of direct compensation and company-sponsored benefit plans. Each component is designed to contribute to a total compensation package that is competitive and appropriately performance-based, and to create incentives for our named executive officers that coincide with our goals and intentions.
Direct Compensation
Direct compensation in 20152017 consisted of base salaries, annual cash incentives, and long-term incentive equity awards in the form of time-based vesting restricted stock grants and performance-based vesting TSRPerformance Equity Awards. Other than base salary, all elements of direct compensation included a component that was directly linked to our performance. By creating these links, we seek to achieve our objectives of performance-based, cost-effective compensation programs. There are no formulas to determine annual base compensation. When setting target direct compensation opportunities, we generally target the market median, but we may also consider other factors, such as competition for certain executive skills and internal needs, an executive’s experience,
recent individual performance and the Company’s strategic priorities. For example, in order to fill vacancies or new positions, or retain certain individuals, we may offer base salaries above the applicable market median or make other compensation adjustments in order to bring our named executive officers closer to the targeted market median. Further, named executive officers who have significant experience and have demonstrated sustained superior performance over time also may have salaries or other elements of compensation above the applicable market median.
Base Salary
Purpose: Base salary is the fixed component of direct compensation and is designed to attract and retain experienced executives who can operate our business in a manner to achieve our short-term and long-term business goals and objectives.
Performance drivers: While a named executive officer’s initial base salary is determined by an assessment of competitive market levels, the major factor driving changes in such base salary will be that named executive officer’s individual performance measured by his or her satisfaction of internal objectives specific to such named executive officer and his assigned responsibilities.
Other Factors: We may also consider various external factors, such as competition for certain executive skills and internal needs, when setting annual base salaries. Although we have historically granted regular, annual merit-based salary increases to officers and salary adjustments as needed to reflect changes in role, responsibility and the competitive environment, such increases are not automatic. Further, we also consider overall levels of compensation in making compensation decisions, and attempt to balance annual base salary amounts with performance-based measures of compensation, such as incentive cash awards and equity awards.
2015: 2017:After several years of no increases, base Base salaries for our continuing named executive officers were increased by approximately 3.9%10.9% on average in 2015 based on2017 reflecting promotions or expansion of responsibilities and increases to bring cash compensation levels of our strong financial performancenamed executive officers more in 2014 andline with the median level of our peer group as part of an effort to ensure competitive total compensation.compensation and to retain employees critical to our success.
Performance-Based AwardsCompensation
Annual Cash Incentives
Purpose: The annual cash incentive award is a variable performance-based compensation component designed to reward the achievement of annual financial and strategic goals.
Application of Performance Measures: As noted above, annual cash bonus awards in 20152017 for our named executive officers were based upon achieving objectives measured by (1) our actual Free Cash Flow and Adjusted EBITDA compared to the respective Financial Performance Measure targetstarget for Free Cash Flow and Adjusted EBITDA (weighted 67%); and (2) the individual performance and contributions of such officer towards the achievement of our strategic objectives based on their respective areas of responsibility (weighted 33%).EBITDA. Minimum levels of Free Cash Flow and Adjusted EBITDA must be achieved for any bonus to fund regardless of individual performance. Where such minimum levels are not reached the pool is not funded and no annual cash incentive awards are paid.
Target Bonus: The Compensation Committee also set a “target” bonus level for each of the named executive officers which was a stated percentage of such officer’s base salary. These target levels in 2017 were 100%110% for the Chief Executive Officer and ranged from 50%65% to 70%75% for the other named executive officers.
2015: 2017:Substantially Actual Adjusted EBITDA, as adjusted, was $420.4 million in 2017, or 99% of target Adjusted EBITDA as a result of depressed energy and metals pricesstrong operational performance, which resulted in 2015 well below historic levels and losses associated with the Durham York construction project, the minimum levelsinitially funded bonus at 97% of $442 million of target.
Adjusted EBITDA and $205 million of Free Cash Flow were not achieved and the incentive cash bonus pool was not funded. Accordingly, no cash incentive bonuses were paid for 2015.
Financial Performance MeasuresGoals
For 2015,2017, the Compensation Committee adopted “minimum,” “threshold,” “target” and “stretch” goal levels for the Financial Performance Measures.Adjusted EBITDA. Based on our 20152017 budget, which was approved by our full Board in December 2014,2016, these levels were reviewed and adjusted by the Compensation Committee in February 20152017 and approved by the Compensation Committee for the full year 20152017 performance on a prospective basis as part of the annual compensation process. We measured financial performance results with a percentage that is calculated from the difference between the “target” and actual level achieved, in accordance with the following table:
|
| |
Financial Performance Level | Payout (% of Target Bonus) |
< Minimum | 0% |
Threshold | 50% |
Target | 100% |
>=Stretch | 200% |
|
| | |
| Adjusted EBITDA Performance Level | Payout (% of Target Bonus) | Adjusted EBITDA as % of Target |
| < Minimum | 0% | 79.9% |
| Threshold | 50% | 80% |
| Target | 100% | 100% |
| >=Stretch | 200% | 120% |
Between each of the foregoing levels, results are interpolated within each category to calculate specific incentive cash award percentages. Financial resultsIncentive cash awards are capped at 200% of target levels for all named executive officers. Under the structure of this series of performance goals, each percentage of performance below the target level results in a reduction in the amount of incentive cash awards relating to financial performance that is greater than the relative amount of increases in such awards that would result from the same percentage of performance above the target level.
The Compensation Committee retains the discretion to make adjustments to the results for any given year. Reasons for adjustments could include removing the effects of unanticipated events, such as accounting changes, project restructurings, timing of working capital, payments of cash bonuses in subsequent calendar years but relating back to the prior calendar year,
insurance payments relating to different calendar years, balance sheet adjustments and similar items, which unless excluded would produce unintended consequences that are inconsistent with the goals of aligning the interests of named executive officers with our stockholders and of providing financial incentives to named executive officers to effectively implement our business plan and goals. No adjustmentsAdjustments were made to the calculations of Adjusted EBITDA or Free Cash Flow in 2015.2017 relating to (i) expected business interruption insurance coverage payments associated with the shutdown of the Fairfax County facility and loss of business in 2017 for which claims were made in 2017 but for which payments are expected to be received in 2018; (ii) removal of business interruption insurance coverage payments relating to the Plymouth facility associated with a shutdown in 2016 but paid in 2017; and (iii) the impact on operations of damage caused by Hurricane Irma on two facilities in Florida. These adjustments reflected equitable adjustments consistent with past practices and a corresponding reverse adjustment to Adjusted EBITDA will be made in 2018 to remove an amount equal to the adjustment relating to the payment of business interruption insurance for the Fairfax County facility losses. Further, in order to mitigate the impact of severe volatility, both positive and negative, in commodity price variances, a floor and ceiling on commodity prices may be imputed into the Adjusted EBITDA calculation to adjust commodities produced and sold during the year based on the commodity price levels anticipated at the time the target level of Adjusted EBITDA was set. Actual commodity prices during 2017 were between the floor and ceiling such that no adjustments were made to Adjusted EBITDA for commodity prices.
The following table summarizes the historical performance targets for the Financial Performance Measures of Adjusted EBITDA and Free Cash Flow, the variances from targets for payout purposes, as calculated in accordance with the foregoing linear pro-rations for the last three years (dollars in millions):
Adjusted EBITDA
|
| | | | | | | | | | | | | | | | | | | | | | | | | |
| | | Adjusted EBITDA | | Free Cash Flow | | |
| | | Target
Adjusted
EBITDA | | Actual
Adjusted
EBITDA, As Adjusted | | Payout Variances (% of Target) | | Target
Free
Cash
Flow | | Actual
Free
Cash
Flow, As Adjusted | | Payout Variances (% of Target) | | Combined Financial Performance |
| 2013 | | $ | 520.0 |
| | $ | 485.4 |
| | 27 | % | | $ | 270.5 |
| | $ | 238.5 |
| | 43 | % | | 34 | % |
| 2014 | | $ | 490.0 |
| | $ | 481.1 |
| | 85 | % | | $ | 205.0 |
| | $ | 223.6 |
| | 131 | % | | 108 | % |
| 2015 | | $ | 520.0 |
| | $ | 428.0 |
| | — | % | | $ | 275.0 |
| | $ | 147.0 |
| | — | % | | — | % |
|
| | | |
| | Target Adjusted EBITDA (in millions) | Actual Adjusted EBITDA, As Adjusted (in millions) | Payout Variances (% of Target) |
2015 1 | $520.0 | $428.0 | 0% |
2016 1 | $420.0 | $417.0 | 95% |
| 2017 | $425.0 | $420.4 | 97% |
1 In 2015, financial performance under the annual cash incentive program was based on a combination of Adjusted EBITDA and Free Cash Flow. Financial performance was weighted 67%, and strategic performance was weighted 33%. In 2016, funding of annual cash incentive awards was based 100% on Adjusted EBITDA.
While budgets and operational targets are reset each year and reviewed and approved by the Board, the Compensation Committee seeks to set financial performance target levels for purposes of the annual incentive cash awards that continue to challenge management, but are achievable if certain conditions are satisfied, including, in particular the following:
we continue to operate our business consistent with the historically high standards of efficiency, production, safety and environmental performance;
we continue to control our costs of conducting our business and operations;
external market forces and pricing are consistent with expectations (at the time we establish our annual budgets) in key areas, including waste, energy, commodity and scrap metal prices and interest rates;
third parties, including communities we serve and the purchasers of the energy we generate, continue to remain financially sound and satisfy their contractual obligations to us; and
we do not experience unforeseen events, such as weather, flooding, accidents or fires at our facilities, acts of God, pandemics, natural disasters, terrorism or other casualty events, that have a material adverse impact on our financial results.
Consequently, our ability to achieve the “target” level of the Financial Performance Measures each year is heavily dependent not only upon factors within our control, but also upon other conditions over which we have no control. There has always been substantial uncertainty with respect to achieving the target level at the time that the Financial Performance Measuresgoals for financial performance measures are set and communicated. During 2012 and 2013prior years, performance resulted in awards below the target levels and it was increasingly necessary for us to seek new and different ways to conduct our business to maintain operating efficiencies and levels of performance; and to find and capitalize on opportunities to expand or improve our profitability. By implementing changes in the way we conduct our business, our financial performance was above target in 2014. However, theA sharp and precipitous decline at the beginning of 2015in commodities
prices well below historical levels in commodities prices,2015, including ferrous and non-ferrous metals and energy, coupled with losses associated with the Durham YorkDurham-York construction project, resulted in our failure to achieve the minimum levels of our Performance Measures of Adjusted EBITDA and Free Cash Flow.Flow necessary to fund the bonus pool for 2015. In 2016, we moved Free Cash Flow to the performance vesting criteria for long-term equity awards and retained Adjusted EBITDA as the sole financial performance measure for purposes of the non-equity incentive compensation plan. Adjusted EBITDA in 2016, as adjusted for certain accounting changes and the further impact of litigation accruals, was $417 million, or 99% of the $420 million target, resulting in incentive cash bonus payouts at 95% of target. In 2017, strong performance offset by the loss of certain revenues associated with the extended shutdown of the Fairfax County facility following a fire in February 2017 resulting in actual Adjusted EBITDA of $408.4 million, which was adjusted to $420.4 million, as described above, or 99% of the $425 million Adjusted EBITDA target, resulting in initial funding of cash bonuses at 97% of target. In 2017, the threshold level was set at 80% of target, or $340 million, and the maximum was set at 120% of target at $510 million of Adjusted EBITDA. Our ability to meet or exceed performance targets in the future will depend upon a variety of factors, including execution of our strategy, contract transitions, managing our exposure to market pricing, competition in our sector, and the age of our facilities and related increased need for additional maintenance expenditures. As a result, it has been and may continue in the future to be, more difficult for our named executive officers to continue to receive incentive cash awards at or near the “target” level and equity awards granted in prior years to be achieved.
Our aggregate financial performance in 2013 was 34% of target, improved to exceed target in 2014 at 108% of target, but in 2015 fell below the minimum levels necessary to fund the cash incentive payment pool.
In addition, the Compensation Committee retains the authority and discretion to increase or decrease the size of any performance-based award or payout. The Compensation Committee did not exerciseexercised such authority and discretion in 20152017 with respect to awards to named executive officers, based uponraising the Financial Performance Measures.
Strategic Objectives
Thecash incentive awards to Messrs. Helgeson and Simpson for their work in the successful refinancing of $400 million of publicly held senior unsecured debt and of the Dublin project and negotiating the arrangements for the strategic objectives were set on a prospective basis in February 2015 bypartnership and joint venture with GIG, and with respect to Mr. Veenhof for his efforts leading the extensions of several service contracts and for creating additional value from our EfW assets. At the request of Mr. Jones, the Compensation Committee as part ofalso exercised its annual compensation processdiscretion to reduce the awards to Messrs. Jones and communicatedde Castro to demonstrate the named executive officers. While we did not meetCompany’s commitment to safety throughout the “minimum” level of performance for the Financial Performance Measures in 2015 and the incentive cash award pool was not funded to pay incentive cash awards for satisfaction of personal contributions towards satisfaction of our strategic objectives, the 2015 compensation structure incorporated individual performance measures in the following three major categories of strategic objectives:organization.
(1) New business and development;
(2) Organic growth in waste and metals; and
(3) Strategic and business goals and risk management.
Within these guidelines, the importance of each category varied significantly between each named executive officer and the importance of such categories was individually determined in order to best tie each such officer’s respective areas of responsibilities and ability to influence, control or impact results with the categories relating to such responsibilities. For example, our Executive Vice President, Sustainable Solutions would have relatively greater weight upon our performance within organic growth categories over which he has the greatest relative level of responsibility and control, therefore, his compensation would be more heavily dependent upon performance towards those objectives within those two categories. Similarly, the Chief Financial Officer has the greatest relative responsibility for our balance sheet, capital structure and financing of our capital expenditures and development projects. Determinations within each of these categories would be based upon subjective judgments of both individual and, where applicable, business area performance. Further, within each of these major categories, individual performance would be further measured by business goals specific to each named executive officer’s responsibilities.
If the annual cash incentive award pool is funded, the Compensation Committee would have received an initial assessment from our Chief Executive Officer of each named executive officer’s performance, other than his own, with respect to each of the applicable business goals for 2015. This recommendation would then have been reviewed by the Compensation Committee in connection with its determination of each named executive officer’s incentive cash award. Many of the factors that influence determinations are subjective, are based upon positive and negative developments occurring during the prior year and vary from year to year based upon our goals and actions undertaken or desired to be taken within such period. As noted above, since the minimum levels for the Financial Performance Measures were not achieved in 2015, the pool was not funded and no such determinations were made by the Compensation Committee.
Overall Performance
The following table compares the award earned by each of the named executive officers, as compared to their respective target bonus opportunity, in each of the last three years:
|
| | | | |
| Named Executive Officer | 2013 Award (%) | 2014 Award (excluding Special Cash Bonus) (%) | 2014 Award (including Special Cash Bonus) (%) | 2015 Award (%) |
Stephen J. Jones(1) | n/a | n/a | n/a | 0 |
Bradford J. Helgeson(2) | 46 | 145 | 170 | 0 |
| Timothy J. Simpson | 44 | 150 | 184 | 0 |
Michael J. de Castro(3) | n/a | n/a | n/a | 0 |
Derek W. Veenhof(4) | n/a | 130 | 142 | 0 |
Matthew R. Mulcahy(5) | n/a | n/a | n/a | 0 |
| Anthony J. Orlando | 42 | 165 | 200 | n/a |
Seth Myones(6) | 48 | 122 | 157 | n/a |
|
| | | |
| Named Executive Officer | 2015 Award (% of target) | 2016 Award1 (% of target) | 2017 Award (% of target) |
Stephen Jones2 | 0 | 95 | 95 |
| Bradford J. Helgeson | 0 | 95 | 107 |
| Michael J. de Castro | 0 | 100 | 95 |
| Derek Veenhof | 0 | 100 | 100 |
| Timothy J. Simpson | 0 | 95 | 102 |
(1) 1 Beginning in 2016 Free Cash Flow was removed as a financial performance measure from the annual cash bonus. While individual performance components were also removed, the Compensation Committee retained the discretion to adjust awards based upon individual strategic performance. All awards starting in 2016 related solely to Adjusted EBITDA.
2 On March 5, 2015, pursuant to agreements entered into on January 5, 2015, Mr. Jones succeeded Anthony J. Orlando as President and Chief Executive Officer. Under his Employment Letter Agreement, the Compensation Committee agreed to award Mr. Jones a cash incentive award equal to 100% of his target cash incentive award as part of his incoming compensation arrangements. As discussed more fully below under CEO Compensation, inIn light of the fact that none of the management team
would be receiving any cash incentive awards, Mr. Jones requested that his guarantee be waived and that he not receive a cash incentive award payment for 2015.
(2) Of the award made in 2014, $60,000 was been held back pending successful operational implementation of certain cost saving and operational efficiency efforts. Mr. Helgeson received this $60,000 in 2016.
(3) Mr. de Castro was not a named executive officer prior to 2015.
(4) Mr. Veenhof was not a named executive officer prior to 2014.
(5) Mr. Mulcahy was not a named executive officer prior to 2015.
(6) Mr. Myones employment with the Company terminated effective April 30, 2015.
As described above, the foregoing awards were consistent with our financial and strategic performance and consistent with the Compensation Committee’s philosophy that individual and company performance above targets would result in corresponding awards in excess of target bonus opportunities while performance below targets would result in corresponding awards below target bonus opportunities. In 2013, Financial Performance Measures for the Company were at 34% of target, with target Financial Performance Measures at 27% of target for Adjusted EBITDA and 43% of target for Free Cash Flow, primarily due to contract transitions and higher interest expense. Performance of our named executive officers against strategic objectives was determined to be 67% of target. Financial Performance Measures carried a weight of 67% while strategic performance carried a relative weight of 33%. On a combined overall basis, the Compensation Committee granted awards in 2013 to named executive officers at 44% of targets. Financial performance rebounded compared to targets in 2014 due to enhanced metals recoveries, improved energy and metals pricing, and our cost savings and efficiency efforts, resulting in Adjusted EBITDA, as adjusted, at 85% of target and Free Cash Flow, as adjusted, at 131% of target, with a combined average performance at 108% of target. The sharp and precipitous decline in commodities prices starting at the beginning of 2015 combined with losses associated with the Durham YorkDurham-York project, resulted in Adjusted EBITDA and Free Cash Flow not achieving minimum levels for funding the cash incentive bonus pool; and accordingly no cash incentive awards were made in 2015. In 2016, strong operational performance resulted in Adjusted EBITDA, as adjusted for the impact of certain accounting changes and the further impact of additional litigation accruals, of $417 million, or 99% of the $420 million target, resulting in payout at 95% of target. Bonuses for 2016 were based 100% on Adjusted EBITDA (there was no strategic performance component). In 2017, continued strong operational performance, highlighted by organic growth, growth in metals management and recovery and growth in environmental services and profiled waste, resulted in Adjusted EBITDA, as adjusted, of $420.4 million, or 99% of the $425 million target, resulting in a payout at 97% of target.
Long-term Long-termIncentiveEquityAwards
Purpose: Long-term incentive equity awards are equity awards designed to attract and retain executives, and to strengthen the link between compensation and increased stockholder value.
Forms of Equity Awards: In 2015,2017, the Compensation Committee granted a combination of time-vesting and performance-vesting restricted stock. In 2015,2017, our Chief Executive Officer and each other named executive officer received equity awards with target grant-date fair values equal to 2.03.4 times for the CEO and ranged from 1.1-1.5 times for theour other named executive officers received equity awards with target grant-date fair values ranging from 1.55 to 2.0 times, respectively, their annual base salary,salaries, with two-thirds in the form of TSRPerformance Equity Awards and one-third in the form of time vesting restricted stock awards.
TSRPerformance Equity Awards-PerformanceAwards - Performance and Vesting Criteria: TSRPerformance Equity Awards are in the form of restricted stock units that are earned and vested three years after grant based upon our relative TSRthree-year cumulative Free Cash Flow per share performance, according to the following table with(with payouts linearly interpolated for performance between levels:levels):
|
| |
Relative TSR Percentile Rank | Payout (% of Target Shares) |
<40th Percentile | 0% |
40th Percentile | 25% |
50th Percentile | 50% |
70th Percentile | 100% |
≥90th Percentile | 200% |
|
| |
| Cumulative Free Cash Flow per Share (2017-2019) | Payout Factor (% of Target Shares) |
| <$3.00 | 0% |
| $3.00 | 50% |
| $4.00 | 100% |
| $4.50 | 150% |
| $5.00 | 200% |
The Compensation Committee chose to require a materially higher threshold than many of the companies in our peer group, with no vesting occurring for that portion of the TSR Equity Awards where our relative TSR performance falls below the 40th percentile of the market indices and 100% of target vesting at the 70th percentile.
Restricted Stock Awards - Vesting: Restricted stock awards granted in 20152017 vest in three equal tranches on March 19, 2018, March 18, 2019 and March 17, of 2016, 2017 and 2018.2020.
The Compensation Committee does not have a specific policy or practice to time equity awards to the release of earnings or other material non-public information. However, the Compensation Committee may determine the value of an equity award but not issue or establish the number of shares or share units while in possession of material non-public information, such as a
material pending transaction. Our practice is not to accelerate or delay the disclosure of material non-public information, whether favorable or unfavorable, but to make such disclosures when appropriate or required by applicable securities laws. In order not to unduly benefit or harm officers and employees, we have in the past postponed, and would consider postponing in the future, the issuance of awards until after the material non-public information has been publicly disclosed or is no longer considered to be material information.
The size of individual long-term incentive equity awards is determined using compensation guidelines developed based on competitive benchmarks. Within those guidelines, actual award recommendations are based on individual, and where applicable, business area performance. Vesting for awards is contingent upon continued employment through the full three-year performance period, of the grant, with certain limited exceptions, including retirement afterat the age of 65.65 or older or, beginning in 2018, early retirement if the sum of the employee's age and years of service equal or exceed 75.
With the importance of aligning the interests of management with our stockholders and assuring that a significant component of our named executive officers’ compensation is tied to performance, as part of aligning the 2017 compensation opportunities for our named executive officers closer to the peer group median, we increased target equity awards to Mr. Veenhof and Mr. de Castro and, to reflect their strong individual performance, we increased the target equity awards to Mr. Helgeson and Mr. Simpson.
CEO Compensation
The Compensation Committee believes that the compensation of our named executive officers should have a very significant component which is not fixed but is “at risk” and performance-based. The Compensation Committee believes that the Chief Executive Officer has the most control and responsibility for our overall performance of any officer and, accordingly, it is appropriate that he have the greatest percentage of compensation at risk and tied to our overall performance.
Successor CEO
On March 5, 2015, Mr. Orlando was succeeded as President and Chief Executive Officer by Stephen J. Jones. Taking into account the Compensation Committee’s compensation philosophy and the need to provide a competitive compensation package compared to our peer group, following several years of demonstrated performance and leadership beginning in a difficult 2015 in which he voluntarily elected to waive his guaranteed cash bonus payment since no bonuses were being paid to employees under the cash incentive plan, in order to attractretain and properly incentivize a new chief executive officer of the caliber of Mr. Jones, the Compensation Committee took notice that Mr. JonesJones’ target compensation opportunity was structuredcloser to the 25th percentile than the median level and determined as partincreased his compensation materially in 2017 to move him closer to the median of an arms’ length negotiating process.the peer group. Consistent with our pay for performance and alignment with stockholders’ philosophies, the most significant portions of the increases in compensation were made in his equity compensation, of which two-thirds was performance-based. Further, due to his responsibility for our performance as Chief Executive Officer, consistent with the intents and purposes of the compensation structure, it was contemplated that Mr. Jones’ compensation would be materially higher than other named executive officers.
Under an Offer Letter executed with Mr. Jones on January 5, 2015, we agreed that
Accordingly, Mr. Jones’ annual compensation for 20152017 as President and Chief Executive Officer would bewas set as follows: (1) annual base salary of $675,000;$800,000; (2) target non-equity incentive compensation of 100%110% of his annual base salary, which amount would be guaranteed to be not less than target for 2015;salary; and (3) target grant-date fair value of equity compensation equal to 200%340% of his annual base salary, structured consistently with annual equity awards to other named executive officers.
In lightofficers of the failure by the Company to achieve the minimum Financial Performance Measures necessary to fund the annual cash incentive bonus pool and the fact that no cash incentive bonuses would be paid to any of the Company’s other officerstwo-thirds, or employees in 2015, Mr. Jones requested that the guarantee of his non-equity incentive compensation be waived and that he not be granted such guaranteed payment.
Prior CEO
After leading our Company following the acquisition of the Covanta Energy business out of bankruptcy proceedings and directing our substantial growth and development for more than ten years, Mr. Orlando was instrumental in efforts to identify Mr. Jones as his successor. Mr. Orlando then provided critical assistance and guidance in the successful coordinated transition to Mr. Jones as the successor Chief Executive Officer. In determining the compensation of Mr. Orlando, the Compensation Committee considered those efforts by Mr. Orlando in setting his final compensation and transition arrangements. Pursuant to the Succession Agreement executed with Mr. Orlando on January 5, 2015: (i) Mr. Orlando’s employment by the Company and its subsidiaries ended on March 5, 2015 and he was succeeded as President and Chief Executive Officer by Mr. Jones; (ii) Mr. Orlando continued as a non-employee member of the Board; (iii) Mr. Orlando become entitled to aggregate salary continuation payments in the amount of $1,510,000 payable on a pro rata basis over a period of 24 months consistent with the senior officer severance plan; (iv) a discretionary special equity bonus was granted$1,822,400, in the form of $1,000,000Performance Equity Awards and one-third, or $897,600, in the form of time-based restricted stock units,equity awards vesting pro rata over a period of three (3) years followingyears.
2018 Compensation Arrangements
In response to stockholder comments and requests to include a direct connection between our stock’s performance and the March 5, 2015 grant datecompensation realized by our officers and employees, we re-examined the use of TSR Equity Awards with our independent advisors and re-introduced TSR Equity Awards in 2018 as one of the numbercomponents of sharesperformance-based equity compensation. Rather than measure our TSR relative to the prior indices of the Standard and Poor’s Midcap 400 Index, the Dow Jones US Conventional Electricity Index, and the Dow Jones US Waste & Disposal Services Index, we determined to compare our TSR against the companies that we view as more of our direct peers. Accordingly, consistent with our compensation adjustments relative to our new customized peer group of 15 companies, we determined that a portion of the performance-based equity compensation for our participating employees and officers, including our named executive officers, should be directly tied to our relative TSR performance against these same companies. Vesting of the TSR Equity Awards will be against metrics consistent with market practices and our peers with vesting determined by the fair market valueCompany’s relative TSR percentile rank versus the companies in the peer group as follows:
|
| |
Relative TSR Percentile Rank 1 | Payout (% of Target Shares) |
<25th percentile | —% |
25th percentile | 50% |
50th percentile | 100% |
70th percentile | 150% |
<90th percentile | 200% |
1 Performance between designated percentiles above the threshold 25th percentile linearly prorated.
Consequently, performance-based equity awards granted in 2018 will have a significant component tied to the Company’s relative TSR as measured against these same peers over a three year performance period. In this way the performance-based equity compensation for our officers, including our named executive officers, will be measured both by a critical internal measure of financial performance (e.g., cumulative Free Cash Flow per share) measured over a three year performance period and an external measure of financial performance (e.g., relative cumulative TSR) measured over a three year performance period as compared to the same peers against which our compensation is benchmarked.
In December 2017, the Company entered into a new strategic partnership with GIG to significantly expand our EfW business in the United Kingdom and Ireland, and in February, 2018 sold a 50% interest in our Dublin project to the joint venture with GIG, which effectively funded our initial combined pipeline of six future development projects. The Company retained full operational control of the common stock of the Company at the close of business on the date of grantDublin EfW facility under an operations and equal to the closing price of the Company’s common stock on the New York Stock Exchange on the date of the grant and subject to the terms and conditions of the applicable equity award agreement; (v) Mr. Orlando became entitled to receive medical, dental, life and other standard employee benefit plans for a period of 24 months consistent with the senior officer severance plan; and (vi) the non-competition and confidentiality provisions of Mr. Orlando’s agreements under the Equity Award Plan would continuemanagement contract. While these transactions were for the longerbenefit of the salary continuation period or the expiration date, if any, of any such agreement.
In addition, pursuant to the Succession Agreement, we agreed to make the following modifications to certain outstanding equity awards: (i) each of the option agreements for Mr. Orlando’s 470,000 vested options was amended to provide for continued exercisability until the expiration of each such option agreement in accordance with its terms as if Mr. Orlando continued to be employed by the Company; (ii) with respect to an aggregate of 53,994 unvested shares of restricted stock of the Company subject to forfeiture pursuant to restricted stock agreements, the restricted stock agreements were amended to permit
vesting on March 17, 2015 as if he continued to be employed by the Company and accelerated the vesting to March 17, 2015 of any restricted stock which vested on March 17, 2016 or March 17, 2017.
2016 Compensation Arrangements
Following the successionall of our chief executive officer after more thanstockholders as we create a decade of service,platform to develop waste infrastructure projects, the Compensation Committee noted that at least 50% of the Free Cash Flow generated by the Dublin facility would no longer be consolidated and management examined different approachesincluded in the cumulative Free Cash Flow as contemplated by the outstanding Performance Equity Awards and would materially and adversely impact the ability of our employees to ourearn their equity incentive compensation programs to incentivize growth while prudently managing risk and maintain an alignment of interests betweenon outstanding awards, as measured by our stockholders and management. As a result, beginning in 2016, we are making substantive revisions to our annual non-equity incentive award program and our long-term equity incentive award program.
Changes to Annual Non-Equity Incentive Award Program
As part of its review of past compensation practices, the Compensation Committee intends to incorporate strategic objectives into the Corporation’s Financial Performance Measurescumulative Free Cash Flow per share. Accordingly, in order to more closely alignretain the interests of management with the Corporation’s stockholders. Beginning in 2016, individual strategic performance goalsequity and the performance measure of Free Cash Flow will be removed and Adjusted EBITDA, which the Company uses to assess short-term profitability, cost control and growth, will be the sole Financial Performance Measure used for awards under our annual cash incentive program. The underlying philosophy of these changes is that strategic goals should be reflected in the measurable financial performanceincentives of the Company in the form of Adjusted EBITDA and Free Cash Flow, while a very important financial performance measure, is better viewed over a longer term period due to its large year over year swings due to the timing of working capital. Further, in order to mitigate the impact of severe volatility, both positive and negative, in commodity prices variances, a floor and ceiling on commodity prices will be imputed into the Adjusted EBITDA calculation to adjust commodities produced and sold during the year based on the commodity price levels anticipated at the time the target level of Adjusted EBITDA is set.
Changes to Long-Termoutstanding Performance Equity Incentive Award Program
Following a review of the TSR program,Awards, the Compensation Committee determined that in practice usingit would equitably adjust the three relative TSR measures for our performance baseddetermination of vesting levels under the outstanding equity awards were not creatingfor the appropriate incentives and alignment with stockholders and determined to reviseremainder of the performance measures of these performance based equity awards. Beginning in 2016,periods under such awards by adjusting the Financial Performance Measure of Free Cash Flow will be shifted from the annual cash incentive award program and be retained for equity compensation arrangements as a replacement to the TSR Equity Awards. New equity incentive awards under the long-term incentive plan in 2016 will be in the form of restricted stock unit awards vesting after a three-year performance period based upon cumulative Free Cash Flow per share overas if the performance period, which we viewDublin EfW facility was still wholly-owned by the Company, as a better metric than TSR to measure growthcontemplated by such awards when granted.
Other material changes in compensation arrangements for 2018 include the formal extension and developmentinclusion of the Corporation’s business and operations and in order to provide a better alignment“Rule of interests. Further, as noted above, the potentially large swings in annual Free Cash Flow tend to even out over an extended period of time making it a better long-term measure of financial performance as well as75” for early retirement providing an appropriate incentive and financial performance measure for the Company to continue to generate sufficient cash flow to enable the Company to continue to return capital to its stockholders.
Further, in recognition of market best practices on acceleration andcontinued vesting of outstanding time-based equity awards following a change in control, beginning with equity awards granted in 2016, all such awards will now be subject to a “double trigger” for accelerationemployees whose sum of age and vesting following a change in control.years of service equals at least 75.
Employment Arrangements
In order to retain the greatest flexibility on compensation decisions, none of our named executive officers have employment agreements. Instead, we incorporated into our standard forms of equity award agreements, primarily for Senior Vice Presidents and higher, the terms of restrictive covenants covering non-competition, non-solicitation, confidentiality and assignment of intellectual property rights. In addition, we provide severance benefits under our severance policy to specified senior officers, including all named executive officers, payable over a period that matches the length of the applicable restrictive covenants. Severance is payable in the event that an eligible employee is terminated for reasons other than cause. See also “Severance Plan and Potential Payments
upon Termination or Change in ControlControl”” below in this proxy statement for more information regarding the severance plan and payments following a change in control. For the purposes of the severance plan, “cause” is defined to include the following:
•an employee’s failure or refusal to perform the duties of his or her employment in a reasonably satisfactory manner;
•fraud or other act of dishonesty;
•serious misconduct in connection with the performance of his or her duties;
•material violation of any applicable policies or procedures;
•conviction of, or plea ofnolo contendere to, a felony or other crime; or
•other conduct that has or reasonably is expected to result in material injury to our business or reputation.
The 24-month24 month severance term for our Chief Executive Officer is longer than the 18-month18 month severance term for other named executive officers because we desired the benefits to us of extended non-competition and non-solicitation covenant periods. Similarly, the 18-month18 month severance period for our Executive Vice Presidents, Senior Vice Presidents, and Chief Accounting Officer and Treasurer, includingwhich includes the other named executive officers, is longer than other eligible employees because we also desired the benefits of their relatively longer restrictive covenant periods.
Company-Sponsored Benefit Plans
Consistent with our philosophy of providing the same forms of compensation throughout a broad spectrum of our managerial base, our executives are eligible to participate in the same benefit plans as those offered to all other non-union employees. We have not provided any perquisites to our named executive officers in any of the last three years.
Insurance Plans
The core insurance package includes health, dental, disability, AD&D and basic group life insurance coverage.
Retirement Plans
We provide a qualified 401(k) retirement plan to all eligible employees, including our named executive officers under which named executive officers may elect to contribute a fixed percentage of their earnings into this plan, up to the limit prescribed for 2017 by the IRS of $270,000 in annual earnings. We provide a matching contribution of 100% of the first 3% of an individual's eligible earnings, and 50% of the next 2% of such individual's eligible earnings up to the IRS limit. Our matching contributions are immediately vested. In addition, we provide eligible employees, including named executive officers, a qualified defined contribution retirement plan. We contribute to this defined contribution plan an amount equal to 3% of an individual's annual eligible compensation as defined in the plan document up to the IRS annual compensation limit, which was $270,000 in 2017. Contributions to the defined contribution plan vest in equal amounts over a five-year period based on continued employment.
We also maintain a non-qualified supplemental defined benefit plan to those of our employees, including those named executive officers, who participated in the Covanta Energy Pension Plan, a qualified defined benefit pension plan, prior to its termination in 2012. Historically, this non-qualified supplemental benefit provided a benefit equivalent to the Covanta Energy Pension Plan benefit for earnings above the Internal Revenue Service earnings cap. This non-qualified supplemental plan represents an unfunded and unsecured obligation to pay a calculated benefit to retiring employees as and when they would otherwise have been eligible to receive a benefit under the now-terminated Covanta Energy Pension Plan. Effective January 1, 2010, we amended our non-qualified supplemental benefit plan to exclude future compensation increases received by eligible participants after December 31, 2009.
Determining Benefit Levels
The Compensation Committee reviews benefit levels periodically to ensure that the plans and programs create the desired incentives for our employees, including named executive officers, which are generally competitive with the applicable marketplace, are cost-effective, and support our human capital needs. Benefit levels are not tied to company, business area or individual performance. In part due to the stock ownership guidelines that we have adopted for our officers and officers of our subsidiary Covanta Energy, we have not reviewed or tied retirement benefits to gains realized upon the exercise of stock options or the sale of restricted stock.
Compensation Policies
Stock Ownership Guidelines
Our Board believes that it is important for all of our officers, including officers of our subsidiary Covanta Energy, to acquire and maintain a substantial equity ownership position in our company. Accordingly, we have established stock ownership guidelines for our officers in order to specifically identify and align the interests of our officers with our stockholders and focus attention on managing our business as an equity owner. Shares counted as ownership include shares owned outright and time-based restricted stock awards. Officers are given five years to reach their target ownership levels. Transition periods are provided for individuals who have been promoted. The current guidelines are as follows:
|
| | |
| Title | | Multiple of Base Salary |
| Chief Executive Officer | | 4.0 x Base Salary |
| Executive Vice Presidents | | 3.0 x Base Salary |
| Senior Vice Presidents | | 2.0 x Base Salary |
| Vice Presidents | | 1.0 x Base Salary |
The Compensation Committee has the sole discretion and authority to modify the stock ownership guidelines at any time.
Insider Derivative and Short-Sale Trading Restrictions
In order to avoid any appearance of a conflict of interest and to prevent opportunities for trading in violation of applicable securities laws, it is our policy that our employees, including our officers and directors, may not purchase or sell options on our common stock, nor engage in short sales with respect to our common stock. Also, we prohibit trading by employees, officers and directors in puts, calls, straddles, equity swaps or other derivative securities that are linked directly to our common stock.
These prohibitions prevent our employees, officers and directors from hedging the economic risk inherent with their ownership of our common stock.
Return and/or Forfeiture of Performance-Based Payments or Awards
Pursuant to a policy formally adopted by our Board and as provided in our TSR Equity Awardequity award agreements and in theour 2014 Equity Award Plan, as required by the Sarbanes-Oxley Act of 2002, the Dodd-Frank Wall Street Reform and Consumer Protection Act, or of any applicable laws, rules or regulations promulgated by the Securities and Exchange Commission from time to time, if any stock award or other payment is based upon the satisfaction of financial performance metrics which are subsequently reversed due to a restatement or reclassification of financial results of the CorporationCompany (excluding certain changes in financial statement presentation that may be excluded from such rules or regulations), then any payments made or awards granted shall be returned and forfeited or recovered to the extent required and as provided by applicable laws, rules, regulations or listing requirements.
Tax Considerations
We generally will be entitled to a tax deduction in connection with awards under the 2014 Equity Award Plan in an amount equal to the ordinary income realized by participants and at the time the participants recognize such income. Special rules limit the deductibility of compensation paid to our named executive officers.
Under section 162(m) of the Tax Code through December 31, 2017, the annual compensation paid to each named executive officer will bewas deductible to the extent it doesdid not exceed $1,000,000 or satisfiessatisfied certain conditions set forth in section 162(m) relating to qualifying performance-based compensation plans. Qualifying performance-based compensation consistsconsisted of compensation paid only if the individual’s performance meetsmet pre-established objective goals based on performance criteria approved by stockholders. The grants of TSRPerformance Equity Awards were designed to satisfy the requirements for deductible compensation; the grant of restricted stock awards doesdid not because such awards arewere time vesting only. Our cash incentive plan is administered so that awards qualify for 162(m) treatment. However, the Compensation Committee retainsretained the discretion to award compensation that exceedsexceeded section 162(m)’s deductibility limit.
With amendments to federal tax laws under the Tax Cut and Jobs Act of 2017, effective for tax years after December 31, 2017, the Tax Cut and Jobs Act repealed the exception for performance-based compensation under section 162(m) so that all compensation paid to covered employees, which includes our named executive officers, beginning in 2018 in excess of $1 million will be nondeductible, including post-termination and post-death payments, severance, deferred compensation and payments from nonqualified plans. The Tax Cut and Jobs Act also modified the definition of a covered employee to include the chief executive officer, the chief financial officer and the three highest paid executive officers other than the chief executive officer and chief financial officer. In addition, once an individual becomes a covered employee for any taxable year beginning after December 31, 2016, that individual will remain a covered employee for all future years, including after termination of employment or even death.
Further, because of uncertainties as to the scope of the transition relief under provisions of the Tax Cut and Jobs Act repealing the performance-based compensation exception, no assurances can be given as to whether awards made in 2017 and paid in 2018 will be deductible can be given until the Internal Revenue Service provides additional guidance. Given the material net operating losses, compensation expenses were not currently deductible and we do not expect the change in law to have a material adverse impact.
COMPENSATION COMMITTEE REPORT
The Compensation Committee has reviewed and discussed with management the Compensation Discussion and Analysis contained in this proxy statement. Based upon the review and discussions, the Compensation Committee has recommended to our Board that the Compensation Discussion and Analysis be included in this proxy statement and incorporated by reference into our Annual Report on Form 10-K for the year ended December 31, 2015.2017. This report is provided by the following independent directors, who, except as set forth below, comprised the Compensation Committee throughout 20152017 and through the date hereof:
Jean Smith (Chair)
Linda Fisher (as of May 4, 2017)
Peter C.B. Bynoe
Robert S. Silberman (Through May 4, 2017)
PETER C.B. BYNOE (CHAIR)
ROBERT S. SILBERMAN
JEAN SMITH
SECURITY OWNERSHIP OF CERTAIN BENEFICIAL OWNERS AND MANAGEMENT
The following tables set forth information, as of March 15, 2016 unless otherwise specified, concerning:
beneficial ownership of our common stock by (1) SZ Investments together with its affiliate EGI-Fund (05-07),(2) Capital International Investors, a division of Capital Research and Management Company; (3) Dimensional Fund Advisors L.P.; (4) The Vanguard Group Inc. and (5) Findlay Park Partners LLP, which are the only beneficial owners known to us of 5% or more of our common stock; and
beneficial ownership of our common stock by (1) all of our current directors, (2) those executive officers named in the Summary Compensation Table included in this proxy statement, referred to as the “named executive officers” in this proxy statement, and (3) all of our current directors and executive officers together as a group.
The number of shares beneficially owned by each entity, person, current director or named executive officer is determined under the rules of the SEC, and the information is not necessarily indicative of beneficial ownership for any other purpose. Under such rules, beneficial ownership includes any shares which the individual has the right to acquire within 60 days after the date of this table, through the exercise of any stock option or other right. Unless otherwise indicated, each person has sole investment and voting power, or shares such powers with his or her spouse or dependent children within his or her household, with respect to the shares set forth in the following table. Unless otherwise indicated, the address for all current executive officers and directors is c/o Covanta Holding Corporation, 445 South Street, Morristown, New Jersey 07960.
Equity Ownership of Certain Beneficial Owners
|
| | | | | | |
| Name and Address of Beneficial Owner | | Number of Shares Beneficially Owned | | Approximate Percent of Class |
SZ Investments L.L.C.(1) | | 12,949,182 |
| | 10.0 | % |
| Two North Riverside Plaza, Suite 600, Chicago, Illinois 60606 | | | | |
Capital International Investors(2) | | 9,111,915 |
| | 7.0 | % |
| 11100 Santa Monica Boulevard, 16th Floor, Los Angeles, California 90025 | | | | |
Dimensional Fund Advisors LP (3) | | 8,115,000 |
| | 6.2 | % |
| Building One, 6300 Bee Cave Road, Austin, Texas 78746 | | | | |
The Vanguard Fund Inc. (4) | | 7,894,213 |
| | 6.1 | % |
| 100 Vanguard Blvd. Malvern, PA 19355 | | | | |
Findlay Park Partners LLP (5) | | 6,850,000 |
| | 5.3 | % |
| Almack House, 4th Floor, 28 King Street, London, SW1Y 6QW United Kingdom | | | | |
| |
(1) | Based on a Schedule 13D/A filed with the SEC on July 25, 2014, this includes the shares owned as follows: |
(a) 10,921,682 shares that SZ Investments beneficially owns with shared voting and dispositive power; (b) 2,027,500 shares that EGI-Fund (05-07) beneficially owns with shared voting and dispositive power; and (c) all 12,949,182 shares listed in the preceding (a) and (b) as beneficially owned by SZ Investments and EGI-Fund (05-07), are also beneficially owned by Chai Trust Company, LLC referred to as “Chai Trust,” with shared voting and dispositive power. Chai Trust is the managing member of EGI-Fund (05-07). SZ Investments is each indirectly controlled by various trusts established for the benefit of Samuel Zell and members of his family, the trustee of each of which is Chai Trust. Mr. Zell is not a director of Chai Trust and thus disclaims beneficial ownership of all such shares, except to the extent of his pecuniary interest therein.
Mr. Zell is an officer of EGI Division. Mr. Zell is an executive officer of EGI-Fund (05-07) and SZ Investments. Mr. Zell was elected as our Chairman of the Board in September 2005 and he also previously served as a director from 1999 to 2004 and as our Chairman of the Board from July 2002 to October 2004, when he did not stand for re-election. In addition, Mr. Zell was our President and Chief Executive Officer from July 2002 until his resignation in April 2004. The addresses of each of EGI-Fund (05-07) and EGI are as set forth in the table above for SZ Investments.
| |
(2) | Based on a Schedule 13G filed with the SEC on February 12, 2016. Capital International Investors, a division of Capital Research and Management Company, has sole voting power with respect to 9,107,015 shares of our common stock and sole dispositive power with respect to 9,111,915 shares of our common stock. |
| |
(3) | Based on a Schedule 13G filed with the SEC on February 9, 2016, Dimensional Fund Advisors LP, in its role as investment advisor to certain investment companies, commingled funds, group trusts and separate accounts, has sole voting power with respect to 7,921,579 of these shares of our common stock and sole dispositive power with respect to 8,115,000 of these shares of our common stock. |
| |
(4) | Based on a Schedule 13G filed with the SEC on February 10, 2016, The Vanguard Group, Inc. has sole voting power with respect to 93,630 shares of our common stock; shared voting power with respect to 6,700 shares of our common stock; sole dispositive power with respect to 7,801,283 shares of our common stock and shared dispositive power with respect to 92,930 shares of our common stock. |
| |
(5) | Based on a Schedule 13G/A filed with the SEC on February 11, 2016, Findlay Park Partners LLP (“Partners”) as the investment manager for Findlay Park Funds PLC - Findlay Park American Fund (the “American Fund”), is the legal owner of these shares of our common stock. As the investment manager, Partners shares voting and dispositive power with respect to these shares of our common stock with the American Fund. The address of American Fund is Styne House, Upper Hatch Street, Dublin 2, Ireland. |
Equity Ownership of Directors and Management
|
| | | | | | | |
| Name | | Number of Shares Beneficially Owned | | | Approximate Percent of Class |
| David M. Barse | | 15,000 |
| | | * |
|
| Ronald J. Broglio | | 4,529 |
| | | * |
|
| Peter C.B. Bynoe | | 75,122 |
| | | * |
|
| Michael J. de Castro | | 41,104 |
| | | * |
|
| Linda J. Fisher | | 40,157 |
| | | * |
|
| Bradford J. Helgeson | | 71,234 |
| | (1) | * |
|
| Joseph M. Holsten | | 107,538 |
| | (1) | * |
|
| Stephen J. Jones | | 185,389 |
| | | * |
|
| Matthew R. Mulcahy | | 142,620 |
| | (1) | * |
|
| Anthony J. Orlando | | 573,267 |
| | (1) | * |
|
| William C. Pate | | 407,177 |
| | | * |
|
| Robert S. Silberman | | 64,500 |
| | | * |
|
| Timothy J. Simpson | | 221,293 |
| | (1) | * |
|
| Jean Smith | | 90,141 |
| | | * |
|
| Derek W. Veenhof | | 96,318 |
| | | * |
|
Samuel Zell(2) | | 13,122,263 |
| | (3) | 10.1 | % |
| All Executive Officers and Directors as a group (18 persons) | | 15,316,703 |
| | (4) | 11.8 | % |
* Percentage of shares beneficially owned does not exceed 1% of the outstanding common stock.
| |
(1) | Includes shares underlying currently exercisable options held by Mr. Helgeson and Mr. Mulcahy to purchase 30,000 and 90,000 shares, respectively, of common stock at an exercise price of $23.30 per share and Mr. Simpson and Mr. Veenhof to purchase 120,000 and 25,000 shares, respectively, of common stock at an exercise price of $20.52 per share. Also includes shares underlying currently exercisable options held by Mr. Orlando to purchase 270,000 shares of common stock at an exercise price of $20.52 per share and 200,000 shares of common stock at an exercise price of $24.76 per share and Mr. Holsten to purchase 25,000 shares of common stock at an exercise price of $20.58 per share. |
| |
(2) | Mr. Zell's address is Two North Riverside Plaza, Suite 600, Chicago, Illinois 60606. |
| |
(3) | Mr. Zell disclaims beneficial ownership as to (a) 10,921,682 shares beneficially owned by SZ Investments, 8,275,682 of which shares are pledged as security to loans and (b) 2,027,500 shares beneficially owned by Fund 05-07, 883,739 of which shares are pledged as security to loans. SZ Investments and Fund 05-07 are each indirectly controlled by various trusts established for the benefit of Mr. Zell and members of his family, the trustee of each of which is Chai Trust. Mr. Zell is not a director or officer of Chai Trust and thus disclaims beneficial ownership of all such shares, except to the extent of his pecuniary interest therein. Also, Mr. Zell disclaims beneficial ownership as to 25,418 shares beneficially owned by the Helen Zell Revocable Trust, the trustee of which is Helen Zell, Mr. Zell’s spouse. |
| |
(4) | Includes shares underlying currently exercisable options to purchase 760,000 shares of common stock that our directors and executive officers have the right to acquire within 60 days of the date of this table. |
Section 16(a) Beneficial Ownership Reporting Compliance
Section 16(a) of the Exchange Act requires our directors and executive officers, and persons who own more than ten percent of a registered class of our equity securities, to file with the SEC initial reports of ownership and reports of changes in ownership of our common stock and other of our equity securities. Executive officers, directors and greater than ten percent stockholders are required by Federal securities regulations to furnish us with copies of all Section 16(a) forms they file.
Based upon a review of filings with the SEC and/or written representations from certain reporting persons, we believe that all of our directors, executive officers and other Section 16 reporting persons complied during 2015 with the reporting requirements of Section 16(a), except that a Form 4 for Mr. de Castro was filed two days late.
Summary Compensation Table For The Year Ended December 31, 20152017
The following table sets forth the compensation for the services in all capacities to us or our subsidiary companies for the years ended December 31, 2015, 20142017, 2016 and 20132015 of (a) our Chief Executive Officer, (b) our Chief Financial Officer, and (c) the three most highly compensated executive officers, other than the Chief Executive Officer and Chief Financial Officer, employed by us as of December 31, 2015, (d) our former Chief Executive Officer who transitioned to Director as of March 5, 2015, (e) our former Executive Vice President and Chief Operating Officer who left the company effective April 30, 2015 and (f) one other executive officer as of December 31, 2015, who is one of the Company's most senpaior executive officers, but was not among the three other most highly compensated executive officers due to his employment for less than half of 2015.2017.
|
| | | | | | | | | | | | | | | | | | | | | | | | | | | | | | |
| Name and Principal Position | | Year | | Salary ($) | | Bonus ($) | | Stock Awards (1) ($) | | Non-Equity Incentive Plan Compensation
($) | | Change in Pension Value and Nonqualified Deferred Compensation Earnings (2) ($) | | All Other Compensation (3)
($) | | Total (4) ($) |
| | | | | | | | | | | | | | | | | |
| Stephen J. Jones | | 2015 | | $ | 675,000 |
| | $ | — |
| | $ | 1,103,929 |
| | $ | — |
| | $ | — |
| | $ | 34,450 |
| | $ | 1,813,379 |
|
| President & Chief | | | | | | | | |
| | | | | | |
|
|
| Executive Officer | | | | | | | | | | | | | | | |
|
|
| | | | | | | | | | | | | | | | | |
| Bradford J. Helgeson | | 2015 | | $ | 365,050 |
| | $ | 60,000 |
| (5) | $ | 1,052,516 |
| (6) | | | $ | — |
| | $ | 22,350 |
| | $ | 1,439,916 |
|
| Executive Vice President | | 2014 | | $ | 350,000 |
| | $ | — |
| | $ | 465,062 |
| (7) | $ | 415,975 |
| (8) | $ | — |
| | $ | 22,076 |
| | $ | 1,253,113 |
|
| & Chief Financial Officer | | 2013 | | $ | 275,734 |
| | $ | — |
| | $ | 243,847 |
| (9) | $ | 55,000 |
| | | | $ | 24,480 |
| | $ | 599,061 |
|
| | | | | | | | | | | | | | | | | |
Michael J. de Castro (10) | | 2015 | | $ | 154,615 |
| | $ | 50,000 |
| (11) | $ | 120,012 |
| (12) | $ | — |
| | $ | — |
| | $ | 4,882 |
| | $ | 329,509 |
|
| Executive Vice President, | | | | | | | | | | | | | | | |
|
|
| Supply Chain | | | | | | | | | | | | | | | |
|
|
| | | | | | | | | | | | | | | | | |
| Timothy J. Simpson | | 2015 | | $ | 373,100 |
| | $ | — |
| | $ | 457,642 |
| | $ | — |
| | $ | — |
| | $ | 61,433 |
| | $ | 892,175 |
|
| Executive Vice President | | 2014 | | $ | 364,000 |
| | $ | — |
| | $ | 483,653 |
| (7) | $ | 435,589 |
| (8) | $ | 74,699 |
| | $ | 55,723 |
| | $ | 1,413,664 |
|
| General Counsel & Secretary | | 2013 | | $ | 364,000 |
| | $ | — |
| | $ | 493,130 |
| (9) | $ | 105,000 |
| | $ | — |
| | $ | 59,815 |
| | $ | 1,021,945 |
|
| | | | | | | | | | | | | | | | | |
Derek W. Veenhof (13) | | 2015 | | $ | 335,160 |
| | $ | — |
| | $ | 411,127 |
| | $ | — |
| | $ | — |
| | $ | 19,283 |
| | $ | 765,570 |
|
| Executive Vice President | | 2014 | | $ | 315,000 |
| | $ | — |
| | $ | 418,560 |
| (7) | $ | 290,812 |
| (8) | $ | — |
| | $ | 19,364 |
| | $ | 1,043,736 |
|
| Sustainable Solutions | | | | | | | | | | | | | | | |
|
|
| | | | | | | | | | | | | | | | | |
Matthew R. Mulcahy(14) | | 2015 | | $ | 286,488 |
| | $ | — |
| | $ | 906,418 |
| (6) | $ | — |
| | $ | — |
| | $ | 19,176 |
| | $ | 1,212,082 |
|
| Senior Vice President and | | | | | | | | | | | | | | | | |
| Head of Corporate | | | | | | | | | | | | | | | | |
| Development | | | | | | | | | | | | | | | | |
| | | | | | | | | | | | | | | | | |
| Former Executive Officers: | | | | | | | | | | | | | | | | |
| Anthony J. Orlando | | 2015 | | $ | 142,289 |
| (15) | $ | — |
| | $ | 1,000,000 |
| | $ | — |
| | $ | — |
| | $ | 560,075 |
| | $ | 1,702,364 |
|
| President and CEO | | 2014 | | $ | 755,000 |
| | $ | — |
| | $ | 1,337,596 |
| (7) | $ | 1,359,000 |
| (8) | $ | 404,803 |
| | $ | 97,572 |
| | $ | 3,953,971 |
|
| | | 2013 | | $ | 755,000 |
| | $ | — |
| | $ | 1,363,768 |
| (9) | $ | 285,000 |
| | | | $ | 108,275 |
| | $ | 2,512,043 |
|
| | | | | | | | | | | | | | | | | |
| Seth Myones | | 2015 | | $ | 130,171 |
| (16) | $ | — |
| | $ | 466,436 |
| | $ | — |
| | $ | — |
| | $ | 195,132 |
| | $ | 791,739 |
|
| Executive Vice President, Chief Operating Officer | | 2014 | | $ | 371,000 |
| | $ | — |
| | $ | 492,973 |
| (7) | $ | 406,798 |
| (8) | $ | 91,006 |
| | $ | 19,571 |
| | $ | 1,381,348 |
|
| | | 2013 | | $ | 371,000 |
| | $ | — |
| | $ | 502,617 |
| (9) | $ | 125,000 |
| | $ | — |
| | $ | 40,967 |
| | $ | 1,039,584 |
|
|
| | | | | | | | | | | | | | | | | | | | | | | | | | | | | | | |
| Name and Principal Position | | Year | | Salary ($) | | Bonus ($) | | Stock Awards (1) ($) | | Non-Equity Incentive Plan Compensation ($) | | Change in Pension Value and Nonqualified Deferred Compensation Earnings (2) ($) | | All Other Compensation (3)($) | | Total ($) |
| Stephen J. Jones | | 2017 | | $ | 800,000 |
| | $ | — |
| | $ | 2,720,000 |
| (4) | $ | 836,000 |
| | $ | — |
| | $ | 19,800 |
| | $ | 4,375,800 |
|
| President & Chief Executive Officer | | 2016 | | $ | 725,000 |
| | $ | — |
| | $ | 1,812,520 |
| (5) | $ | 688,750 |
| | $ | — |
| | $ | 57,855 |
| | $ | 3,284,125 |
|
| | | 2015 | | $ | 675,000 |
| | $ | — |
| | $ | 1,103,929 |
| | $ | — |
| | $ | — |
| | $ | 34,450 |
| | $ | 1,813,379 |
|
| | | | | | | | | | | | | | | | |
|
|
| Bradford J. Helgeson | | 2017 | | $ | 450,000 |
| | $ | — |
| | $ | 900,000 |
| (4) | $ | 360,100 |
| | $ | — |
| | $ | 9,083 |
| | $ | 1,719,183 |
|
| Executive Vice President & Chief Financial Officer | | 2016 | | $ | 400,000 |
| | $ | — |
| | $ | 600,000 |
| (5) | $ | 266,000 |
| | $ | — |
| | $ | 62,762 |
| | $ | 1,328,762 |
|
| | | 2015 | | $ | 365,050 |
| | $ | 60,000 |
| (6) |
| $ | 1,052,516 |
| (7) | $ | — |
| | $ | — |
| | $ | 22,350 |
| | $ | 1,499,916 |
|
| | | | | | | | | | | | | | | | | |
| Timothy J. Simpson | | 2017 | | $ | 391,400 |
| | $ | — |
| | $ | 606,825 |
| (4) | $ | 259,100 |
| | $ | 73,341 |
| | $ | 19,755 |
| | $ | 1,350,421 |
|
| Executive Vice President General Counsel & Secretary | | 2016 | | $ | 380,000 |
| | $ | — |
| | $ | 760,000 |
| (5) | $ | 234,650 |
| | $ | 34,956 |
| | $ | 78,065 |
| | $ | 1,487,671 |
|
| | | 2015 | | $ | 373,100 |
| | $ | — |
| | $ | 457,642 |
| | $ | — |
| | $ | — |
| | $ | 61,433 |
| | $ | 892,175 |
|
| | | | | | | | | | | | | | | | | |
Michael J. de Castro | | 2017 | | $ | 400,000 |
| | $ | — |
| | $ | 640,000 |
| (4) | $ | 266,200 |
| | $ | — |
| | $ | 19,774 |
| | $ | 1,325,974 |
|
| Executive Vice President, Supply Chain | | 2016 | | $ | 350,000 |
| | $ | — |
| | $ | 700,000 |
| | $ | 227,500 |
| | $ | — |
| | $ | 34,146 |
| | $ | 1,311,646 |
|
| | | 2015 | | $ | 154,615 |
| | $ | 50,000 |
| (8 | ) | $ | 120,012 |
| (9) | $ | — |
| | $ | — |
| | $ | 4,882 |
| | $ | 329,509 |
|
| | | | | | | | | | | | | | | | | |
| Derek W. Veenhof | | 2017 | | $ | 400,000 |
| | $ | — |
| | $ | 640,000 |
| (4) | $ | 279,700 |
| | $ | — |
| | $ | 19,774 |
| | $ | 1,339,474 |
|
| Executive Vice President, Sustainable Solutions | | 2016 | | $ | 350,000 |
| | $ | — |
| | $ | 700,000 |
| (5) | $ | 227,500 |
| | $ | — |
| | $ | 34,146 |
| | $ | 1,311,646 |
|
| | | 2015 | | $ | 335,160 |
| | $ | — |
| | $ | 411,127 |
| | $ | — |
| | $ | — |
| | $ | 19,283 |
| | $ | 765,570 |
|
| |
| (1) | Represents the aggregate grant date fair value computed in accordance with FASB ASC Topic 718. The grant date fair value for time-based restricted stock is computed using the closing price of the shares on the grant date. The grant date fair value for the performance TSR-basedtotal stockholder return (“TSR”)-based restricted stock units was calculated by using a Monte Carlo simulation, which produced a probable value for the awards at $16.60 per share for the 2013 grant, $14.13 for the 2014 grant and $15.98 per share for the 2015 grant. TSRThe TSR-based equity awards will vest at the end of the three-year vesting term, however, the number of shares delivered will vary based upon the attained level of performance and may range from 0 to 2.0 times the number of target units awarded. The TSR-based equity awards granted in 2015 and vesting in March 2018 are not expected to have any value and will not vest. The grant date fair value for the Performance Equity Awards measured by cumulative Free Cash Flow per share performance-based equity awards granted in 2016 and 2017 were computed using the closing price of the common stock on the grant date. The Performance Equity Awards will vest at the end of the three-year vesting term,performance period, however, the number of shares delivered will vary based upon the attained level of performance and may range from 0 to 2.0 times the number of target units awarded. |
| |
| (2) | The amounts shown for each named executive officerMr. Simpson in this column are attributable to the change in actuarial present value of the accumulated benefit under defineda supplemental benefit and actuarial plansplan that was frozen in 2009, at December 31, of the applicable year, as compared to |
December 31, of the immediately preceding year. For Messrs. Orlando, Myones, and Simpson, the actual change in pension value in 2013 was negative as follows: Orlando $215,587, Myones $130,034, Simpson $38,437. For Messrs. Orlando, Myones, Simpson and Mulcahy, the actual change in pension value in 2015 was negative as follows: Orlando $154,108, Myones $29,092, Simpson $29,092, Mulcahy $3,223. Pursuant to SEC guidance, these amounts have December 31, of the immediately preceding year. The actual change in pension value in 2015 was negative $29,092 and pursuant to SEC guidance, this amount has been omitted from the table.
| |
| (3) | The amounts shown in this column for 20152017 consist of the following components: |
| | | Name | | Company 401(k) Match(a) | | Company Contribution to Defined Contribution Plan(b) | | Life Insurance Premiums Paid by Company | | Severance Payments and Outplacement Service | | Perquisites (c) | | Dividends Accrued on Performance Based Equity Incentive Awards | | Total | | Company 401(k) Match(a) | | Company Contribution to Defined Contribution Plan(b) | | Life Insurance Premiums Paid by Company | | Total |
| Stephen J. Jones | | $ | 10,600 |
| | $ | 7,950 |
| | $ | 900 |
| | $ | — |
| | $ | 15,000 |
| | $ | — |
| | $ | 34,450 |
| | $ | 10,800 |
| | $ | 8,100 |
| | $ | 900 |
| | $ | 19,800 |
|
| Bradford J. Helgeson | | $ | 10,600 |
| | $ | 7,950 |
| | $ | 798 |
| | $ | — |
| | $ | — |
| | $ | 3,002 |
| | $ | 22,350 |
| | $ | — |
| | $ | 8,100 |
| | $ | 983 |
| | $ | 9,083 |
|
| Timothy J. Simpson | | | $ | 10,800 |
| | $ | 8,100 |
| | $ | 855 |
| | $ | 19,755 |
|
| Michael J. de Castro | | $ | — |
| | $ | 4,638 |
| | $ | 244 |
| | $ | — |
| | $ | — |
| | $ | — |
| | $ | 4,882 |
| | $ | 10,800 |
| | $ | 8,100 |
| | $ | 874 |
| | $ | 19,774 |
|
| Timothy J. Simpson | | $ | 10,600 |
| | $ | 7,950 |
| | $ | 816 |
| | $ | — |
| | $ | — |
| | $ | 42,067 |
| | $ | 61,433 |
| |
| Derek W. Veenhof | | $ | 10,600 |
| | $ | 7,950 |
| | $ | 733 |
| | | | $ | — |
| | $ | — |
| | $ | 19,283 |
| | $ | 10,800 |
| | $ | 8,100 |
| | $ | 874 |
| | $ | 19,774 |
|
| Matthew R. Mulcahy | | $ | 10,600 |
| | $ | 7,950 |
| | $ | 626 |
| | $ | — |
| | $ | — |
| | $ | — |
| | $ | 19,176 |
| |
| Former Executive Officers: | | | | | | | | | | | | | | | |
| Anthony J. Orlando | | $ | 5,692 |
| | $ | 4,269 |
| | $ | 182 |
| | $ | 459,788 |
| | $ | — |
| | $ | 90,144 |
| | $ | 560,075 |
| |
| Seth Myones | | $ | 5,207 |
| | $ | 3,905 |
| | $ | 270 |
| | $ | 185,750 |
| | $ | — |
| | $ | — |
| | $ | 195,132 |
| |
| |
| (a) | Represents matching contributions to the 401(k) account under the Covanta Energy Savings Plan of each named executive officer. See the description of the plan in “Retirement Plans” for more information. |
| |
| (b) | Represents contributions to the defined contribution retirement plan account under the Covanta Energy Savings Plan of each named executive officer. See the description of the plan in “Retirement Plans” for more information. |
| |
(c) | Represents agreed upon legal fee reimbursements for costs incurred in connection with Mr. Jones' employment in early 2015.
|
| |
| (4) | Represents the sumIncludes $16.30 of the amountsgrant date fair value for restricted stock unit Performance Equity Awards based upon cumulative Free Cash Flow per share and time-based restricted stock or restricted stock unit awards granted in all of the columns of the Summary Compensation Table for each named executive officer.2017. |
| |
| (5) | Includes $15.11 of grant date fair value for restricted stock unit Performance Equity Awards based upon cumulative Free Cash Flow per share and time-based restricted stock or restricted stock unit awards granted in 2016. |
| |
| (6) | Represents a portion of a special cash bonus for 2014 that had been held back pending successful operational implementation of certain cost saving and operational efficiency efforts. |
| |
(6)(7) | Includes award of performance based restricted stock units, valued at the time of grant at $604,725 for Mr. Helgeson and $648,705 for Mr. Mulcahy. These awards vestHelgeson. This award vests after a period of at least three years based upon successful achievement of specified criteria and confirmation of a bring-down calculation by the Compensation Committee. |
| |
(7) | Includes $14.13 of grant date fair value for TSR awards and $17.05 of grant date fair value for restricted stock awards. |
| |
| (8) | Amounts included for 2014 represent the value of the annual incentive cash awards plus the special cash incentive awards received by each named executive officer in March 2015 in respect of service performed in 2014. |
| |
(9) | Includes $16.60 of grant date fair value for TSR awards and $19.42 of grant date fair value for restricted stock awards. |
| |
(10) | Mr. de Castro was not an executive officer of the Company prior to 2015. |
| |
(11) | Represents a new hire bonus received in July 2015. |
| |
(12)(9) | Represents a restricted stock award upon commencement of employment vesting pro rata over four years beginning in March 2016. |
| |
(13) | Mr. Veenhof was not an executive officer of the Company in 2013. |
| |
(14) | Mr. Mulcahy was not an executive officer of the Company prior to 2015. |
| |
(15) | Mr. Orlando's 2015 salary payments prior to his departure as an employee were $142,289. Mr. Orlando also was paid $435,577 in salary continuation payments and $24,211 for unused vacation time in 2015. |
| |
(16) | Mr. Myones' 2015 salary payments prior to his departure as an employee were $130,171. Mr. Myones also was paid $160,886 in salary continuation payments and $24,864 for unused vacation time in 2015. |
Equity Award Plans
All equity awards made to the named executive officers in 20152017 were made pursuant to the 2014 equity award plan for employees and officers, which we refer to as the “2014 Equity Award Plan.” The 2014 Equity Award Plan is administered by the Compensation Committee of our Board. Awards under the 2014 Equity Award Plan were granted to employees (including officers) of the Company, its subsidiaries and affiliates. The 2014 Equity Award Plan provides for awards to be made in the form of (a) shares of restricted stock, (b) incentive stock options, (c) non-qualified stock options, (d) stock appreciation rights, (e) performance awards, (f) restricted stock units or (g) other stock-based awards which relate to or serve a similar function to the awards described above. Awards could be made on a stand-alone, combination or tandem basis.
As of March 17, 2015,12, 2018, there were 5,724,2983,204,944 shares of common stock available for issuance under the 2014 Equity Award Plan, and no recipient under the Plan may be granted awards in any calendar year with respect to more than 250,000 shares of restricted stock; or restricted stock units and options to purchase 650,000 shares, 250,000 performance shares or $5.0 million of performance units.
The following table provides information on both equity incentive awards that were made under the 2014 Equity Award Plan and incentive cash awards made during the year ended December 31, 2015.2017.
Grants of Plan-Based Awards — 20152017
| | | | | Estimated Possible Payouts Under Non-Equity Incentive Plan Awards(1) | | Estimated Future Payouts Under Equity Incentive Plan Awards(2) | | All Other Stock Awards: Number of Shares of Stock or Units (3) | | All Other Option Awards: Number of Securities Underlying Options | | Exercise or Base Price of Option Awards | | Grant Date Fair Value of Stock and Option Awards (4) | | | Estimated Possible Payouts Under Non-Equity Incentive Plan Awards(1) | | Estimated Future Payouts Under Equity Incentive Plan Awards(2) | | All Other Stock Awards: Number of Shares of Stock or Units (3) | | All Other Option Awards: Number of Securities Underlying Options | | Exercise or Base Price of Option Awards | | Grant Date Fair Value of Stock and Option Awards (4) |
| | | Threshold | | Target | | Maximum | | Threshold | | Target | | Maximum | | | | Threshold | | Target | | Maximum | | Threshold | | Target | | Maximum | |
| Name | Grant Date | | ($) | | ($) | | ($) | | (#) | | (#) | | (#) | | (#) | | (#) | | ($/sh) | | ($) | | Grant Date | | ($) | | ($) | | ($) | | (#) | | (#) | | (#) | | (#) | | (#) | | ($/sh) | | ($) |
| Stephen J. Jones | March 5, 2015 | | $ | 337,500 |
| | $ | 675,000 |
| | $ | 1,350,000 |
| | — | | — |
| | — | | — |
| | — | | — | | $ | — |
| | | $ | 440,000 |
| | $ | 880,000 |
| | $ | 1,760,000 |
| | — | | — |
| | — | | — |
| | — | | — | | $ | — |
|
| | March 5, 2015 | | $ | — |
| | $ | — |
| | $ | — |
| | 10,237 | | 40,949 |
| | 81,898 | | — |
| | — | | — | | $ | 654,365 |
| | March 2, 2017 | | $ | — |
| | $ | — |
| | $ | — |
| | 55,902 | | 111,804 |
| | 223,608 | | — |
| | — | | — | | $ | 1,822,400 |
|
| | March 5, 2015 | | $ | — |
| | $ | — |
| | $ | — |
| | — | | — |
| | — | | 20,444 |
| | — | | — | | $ | 449,564 |
| | March 2, 2017 | | $ | — |
| | $ | — |
| | $ | — |
| | — | | — |
| | — | | 55,067 |
| | — | | — | | $ | 897,600 |
|
| | | | | | | | | | | | | | |
| Bradford J. Helgeson | March 5, 2015 | | $ | 127,768 |
| | $ | 255,535 |
| | $ | 511,070 |
| | — | | — |
| | — | | — |
| | — | | — | | $ | — |
| | | $ | 168,750 |
| | $ | 337,500 |
| | $ | 675,000 |
| | — | | — |
| | — | | — |
| | — | | — | | $ | — |
|
| | | March 2, 2017 | | $ | — |
| | $ | — |
| | $ | — |
| | 18,497 | | 36,994 |
| | 73,988 | | — |
| | — | | — | | $ | 603,000 |
|
| | | March 2, 2017 | | | | | | | | | | 18,221 |
| | $ | 297,000 |
|
| | | | | | | | | | | | | | |
| Timothy J. Simpson | | | $ | 127,205 |
| | $ | 254,410 |
| | $ | 508,820 |
| | — | | — |
| | — | | — |
| | — | | — | | $ | — |
|
| | March 5, 2015 | | $ | — |
| | $ | — |
| | $ | — |
| | 4,153 | | 16,610 |
| | 33,220 | | — |
| | — | | — | | $ | 265,428 |
| | March 2, 2017 | | $ | — |
| | $ | — |
| | $ | — |
| | 12,472 | | 24,943 |
| | 49,886 | | — |
| | — | | — | | $ | 406,570 |
|
| | March 5, 2015 | | $ | — |
| | $ | — |
| | $ | — |
| | 13,750 | | 27,500 |
| (5 | ) | 55,000 | | — |
| | — | | — | | $ | 604,725 |
| | March 2, 2017 | | $ | — |
| | $ | — |
| | $ | — |
| | — | | — |
| | — | | 12,285 |
| | — | | — | | $ | 200,255 |
|
| | March 5, 2015 | | | | | | | | | | 8,293 |
| | $ | 182,383 |
| | | | | | | | | | | | | |
| Michael J. de Castro | July 13, 2015 | | $ | 108,875 |
| | $ | 217,750 |
| | $ | 435,500 |
| | — | | — |
| | — | | — |
| | — | | — | | $ | — |
| | | $ | 140,000 |
| | $ | 280,000 |
| | $ | 560,000 |
| | — | | — |
| | — | | — |
| | — | | — | | $ | — |
|
| | July 13, 2015 | | $ | — |
| | $ | — |
| | $ | — |
| | — | | — |
| | — | | 5,677 |
| | — | | — | | $ | 120,012 |
| (6 | ) | March 2, 2017 | | $ | — |
| | $ | — |
| | $ | — |
| | 13,154 | | 26,307 |
| | 52,614 | | — |
| | — | | — | | $ | 428,800 |
|
| Timothy J. Simpson | March 5, 2015 | | $ | 121,258 |
| | $ | 242,515 |
| | $ | 485,030 |
| | — | | — |
| | — | | — |
| | — | | — | | $ | — |
| | |
| | March 5, 2015 | | $ | — |
| | $ | — |
| | $ | — |
| | 4,244 | | 16,976 |
| | 33,952 | | — |
| | — | | — | | $ | 271,276 |
| | March 2, 2017 | | $ | — |
| | $ | — |
| | $ | — |
| | — | | — |
| | — | | 12,957 |
| | — | | — | | $ | 211,200 |
|
| | March 5, 2015 | | $ | — |
| | $ | — |
| | $ | — |
| | — | | — |
| | — | | 8,475 |
| | — | | — | | $ | 186,365 |
| | | | | | | | | | | | | |
| Derek W. Veenhof | March 5, 2015 | | $ | 108,927 |
| | $ | 217,854 |
| | $ | 435,708 |
| | — | | — |
| | — | | — |
| | — | | — | | $ | — |
| | | $ | 140,000 |
| | $ | 280,000 |
| | $ | 560,000 |
| | — | | — |
| | — | | — |
| | — | | — | | $ | — |
|
| | March 5, 2015 | | $ | — |
| | $ | — |
| | $ | — |
| | 3,813 | | 15,250 |
| | 30,500 | | — |
| | — | | — | | $ | 243,695 |
| | March 2, 2017 | | $ | — |
| | $ | — |
| | $ | — |
| | 13,154 | | 26,307 |
| | 52,614 | | — |
| | — | | — | | $ | 428,800 |
|
| | March 5, 2015 | | $ | — |
| | $ | — |
| | $ | — |
| | — | | — |
| | — | | 7,614 |
| | — | | — | | $ | 167,432 |
| | March 2, 2017 | | $ | — |
| | $ | — |
| | $ | — |
| | — | | — |
| | — | | 12,957 |
| | — | | — | | $ | 211,200 |
|
| Matthew R. Mulcahy | March 5, 2015 | | $ | 71,622 |
| | $ | 143,244 |
| | $ | 286,488 |
| | — | | — |
| | — | | — |
| | — | | — | | $ | — |
| | |
| | March 5, 2015 | | | | | | | | 2,390 | | 9,559 |
| | 19,118 | | | | $ | 152,753 |
| | |
| | March 5, 2015 | | | | | | | | 7,375 | | 29,500 |
| (5 | ) | 59,000 | | | | $ | 648,705 |
| | |
| | March 5, 2015 | | | | | | | | | | 4,773 |
| | $ | 104,958 |
| | |
| Former Executive Officers: | | | | | | | | | | | | | | |
| Anthony J. Orlando | March 5, 2015 | | $ | — |
| | $ | — |
| | $ | — |
| | — | | — |
| | — | | 45,476 |
| | — | | — | | $ | 1,000,000 |
| | |
| Seth Myones | March 5, 2015 | | $ | — |
| | $ | — |
| | $ | — |
| | 4,326 | | 17,302 |
| | 34,604 | | — |
| | — | | — | | $ | 276,486 |
| | |
| | March 5, 2015 | | $ | — |
| | $ | — |
| | $ | — |
| | — | | — |
| | — | | 8,638 |
| | — | | — | | $ | 189,950 |
| | |
| |
| (1) | In February 2014,March 2017, our Compensation Committee established various levels of performance. The amounts shown in these columns reflect the range of potential payouts for 20142017 performance under our annual incentive cash award plan between the "threshold" and "maximum" levels. The amounts shown in the “threshold” column represent the amount of cash award payable at the 50% of "target" level of performance. In addition, there is a "minimum" level of Company performance below the "threshold" which if not attained will result in no cash awards being payable. Please see the “Compensation Discussion and Analysis” in this proxy statement for more information regarding these awards and performance measures. |
| |
| (2) | The number of shares of Company common stock actually delivered to executive officers at the end of the three year TSR cycleperformance period can range from 0% to 200% of the number of target shares awarded.awarded, measured against a target of $4.00. If the relative TSRcumulative Free Cash Flow per share is below the 40th percentile of any of the peer group participantsless than $3.00, then no shares will not receive any shares at the end of the performance period with respect to that peer group and will not receive any cash dividend equivalents.be issued. If the relative TSRcumulative Free Cash Flow per share is at least at the 40th percentile of the designated peer groupequal to or above $3.00, then a threshold payout of 25% of the number of target shares will begin to be allocated to each participant with respect to that peer group plus cash dividend equivalents relative to the number of shares awarded.participant. To receive 100% of target the Company's TSRcumulative Free Cash Flow per share must perform at the 70th percentile comparedbe equal to the designated peer group.$4.00. Participants can earn up to 200% of target if the Company performs at the 90th percentile.Company's cumulative Free Cash Flow per share equals or exceeds $5.00. Awards are interpolated on a straight-line basis for performance results between levels. Please see the "Compensation Discussion and Analysis" in this proxy statement for more information regarding these awards. |
results between levels. Please see the “Compensation Discussion and Analysis” in this proxy statement for more information regarding these awards and growth goals.
| |
| (3) | The number of shares shown reflects the 20152017 restricted stock awards under the 2014 Equity Award Plan. The restricted stock awards made in 20152017 vested ratably over three years, on the basis of continued employment. The restricted stock units vest in accordance with successful achievement of pre-established growth goals. |
| |
| (4) | Represents the grant date fair value of the awards computed in accordance with FASB ASC Topic 718. The grant date fair value for time-based restricted stock is computed using the closing price of the shares at the grant date. The grant date fair value for the performance TSR-basedperformance-based restricted stock units was calculated by using a Monte Carlo simulation, which produced a probable value for the awards at $15.98tied to cumulative Free Cash Flow per share for 2015.was equal to the closing price of our common stock on the grant date. For our named executive officers, we have assumed for calculating the grant date fair value under FASB ASC Topic 718 that the forfeiture rate was zero. |
| |
(5) | Performance based awards in the form of restricted stock units awarded on March 5, 2015 with a grant price of $21.99. These awards vest after a period of at least three years based upon successful achievement of specified criteria and confirmation of a bring-down calculation by the Compensation Committee. |
| |
(6) | New hire grant awarded on July 13, 2015 with a grant price of $21.14 vesting pro rata over a period of four years. |
The following table sets forth the outstanding equity awards held by each of our named executive officers as of December 31, 2015:2017:
Outstanding Equity Awards at Fiscal Year-End 20152017
| | | | | Option Awards | | Stock Awards | | Stock Awards |
| Name | | Number of Securities Underlying Unexercised Options Exercisable (#) | | Number of Securities Underlying Unexercised Options Unexercisable (#) | | Option Exercise Price ($) | | Option Expiration Date | | Number of Shares or Units of Stock That Have Not Vested (#) | | | | Market Value of Shares or Units of Stock That Have Not Vested (1) ($) | | Equity Incentive Plan Awards: Number of Unearned Shares, Units or Other Rights That Have Not Vested (#) | | Equity Incentive Plan Awards: Market or Payout Value of Unearned Shares, Units or Other Rights That Have Not Vested (1) ($) | | Number of Shares or Units of Stock That Have Not Vested (#) | | | | Market Value of Shares or Units of Stock That Have Not Vested (1) ($) | | Equity Incentive Plan Awards: Number of Unearned Shares, Units or Other Rights That Have Not Vested (#) | | | | Equity Incentive Plan Awards: Market or Payout Value of Unearned Shares, Units or Other Rights That Have Not Vested (1) ($) |
| Stephen J. Jones | | — |
| | — |
| | | | — |
| | 20,444 |
| | (2) | | $ | 316,678 |
| | 40,949 |
| (3) | $ | 634,300 |
| | 6,815 |
| | (6) | | $ | 1,495,853 |
| | 80,010 |
| | (3) | | $ | 3,933,695 |
|
| | | | 26,630 |
| | (2) | | | | 111,804 |
| | (3) | | |
| | | | 55,067 |
| | (4) | | | | 40,949 |
| | (5)(8) | | |
| | | | | | | | | | |
| | | | | | | | | | | | | | | | | | | | | | | | | |
| Bradford J. Helgeson | | 30,000 |
| | — |
| | $ | 23.30 |
| | 5/7/2017 |
| | 1,544 |
| | (4) | | $ | 258,373 |
| | 3,002 |
| (5) | $ | 1,191,382 |
| | 2,765 |
| | (6) | | $ | 503,654 |
| | 3,002 |
| | (7) | | $ | 1,869,005 |
|
| | | | | | | | | | | 6,843 |
| | (6) | | | | 27,500 |
| (5) | | | 8,816 |
| | (2) | | | | 27,500 |
| | (7) | | |
| | | | | | | | | | | 8,293 |
| | (2) | | | | 9,273 |
| (7) | | | 18,221 |
| | (4) | | | | 26,486 |
| | (3) | | |
| | | | | | | | | | | | | | | 20,528 |
| (3) | | | | | | | 36,994 |
| | (3) | | |
| | | | | | | | | | | | | | | 16,610 |
| (3) | | | | | | | 16,610 |
| | (8) | | |
| | | | | | | | | | | | | | | | | | | | | | | | | |
| Michael J. de Castro | | — |
| | — |
| | | | — |
| | 5,677 |
| | (8) | | $ | 87,937 |
| | — |
| | | |
| | | | | | | | | | | | | | | | | | |
| Timothy J. Simpson | | 120,000 |
| | — |
| | $ | 20.52 |
| | 3/19/2017 |
| | 3,121 |
| | (4) | | $ | 289,849 |
| | 42,067 |
| (5) | $ | 1,679,364 |
| | 2,825 |
| | (6) | | $ | 444,081 |
| | 42,067 |
| | (7) | | $ | 1,986,342 |
|
| | | | | | | | | | | 7,116 |
| | (6) | | | | 9,271 |
| (5) | | | 11,167 |
| | (2) | | | | 33,549 |
| | (3) | | |
| | | | | | | | | | | 8,475 |
| | (2) | | | | 18,753 |
| (7) | | | 12,285 |
| | (4) | | | | 24,943 |
| | (3) | | |
| | | | | | | | 16,976 |
| | (8) | | |
| | | | | | | | | | |
| Michael J. de Castro | | | 2,839 |
| | (9) | | $ | 440,769 |
| | 30,901 |
| | (3) | | $ | 966,815 |
|
| | | | | | | | | | | | | | | 21,349 |
| (3) | | | 10,285 |
| | (2) | | | | 26,307 |
| | (3) | | |
| | | | | | | | | | | | | | | 16,976 |
| (3) | | | 12,957 |
| | (3) | | | | | | |
| | | | | | | | | | | | | | | | | | | | | | | | | |
| Derek W. Veenhof | | 25,000 |
| | — |
| | $ | 20.52 |
| | 3/19/2017 |
| | 1,372 |
| | (4) | | $ | 234,596 |
| | — |
| | $ | 650,084 |
| | 2,538 |
| | (6) | | $ | 435,682 |
| | 30,901 |
| | (3) | | $ | 1,224,540 |
|
| | | | | | | | | | | 6,159 |
| | (6) | | | | 8,243 |
| (3) | | | 10,285 |
| | (2) | | | | 26,307 |
| | (3) | | |
| | | | | | | | | | | 7,614 |
| | (2) | | | | 18,475 |
| (7) | | | 12,957 |
| | (4) | | | | 15,250 |
| | (8) | | |
| | | | | | | | | | | | | | | 15,250 |
| (3) | | |
| | | | | | | | | | | | | | | | | | |
| | | | | | | | | | | | | | | | | | |
| Matthew R. Mulcahy | | 90,000 |
| | — |
| | $ | 20.52 |
| | 3/19/2017 |
| | 1,715 |
| | (4) | | $ | 161,065 |
| | 6,181 |
| (5) | $ | 1,042,074 |
| |
| | | | | | | | | | | 3,910 |
| | (6) | | | | 29,500 |
| (5) | | |
| | | | | | | | | | | 4,773 |
| | (2) | | | | 10,304 |
| (7) | | |
| | | | | | | | | | | | | | | 11,730 |
| (3) | | |
| | | | | | | | | | | | | | | 9,559 |
| (3) | | |
| | | | | | | | | | | | | | | | | | |
| Former Executive Officers: | | | | | | | | | | | | | | | | | |
| Anthony J. Orlando | | 270,000 |
| | | | $ | 20.52 |
| | 3/19/2017 |
| | 45,476 |
| | (2) | | $ | 704,423 |
| | — |
| | $ | 3,305,721 |
| |
| | | 200,000 |
| | | | $ | 24.76 |
| | 2/21/2018 |
| | — |
| | | | | | | |
| Seth Myones | | — |
| | — |
| | | | — |
| | — |
| | | | 12,361 |
| (5) | $ | 1,092,618 |
| |
| | | | | | | | | | | — |
| | | | 17,302 |
| (7) | | |
| | | | | | | | | | | — |
| | | | 21,760 |
| (3) | | |
| | | | | | | | | | | | | | | 19,114 |
| (3) | | |
| |
| (1) | Based on the closing price of our common stock of $15.49$16.90 on December 31, 2015,29, 2017, the last trading day of the year, as reported on the New York Stock Exchange. |
| |
| (2) | Restricted stock vests in threetwo equal installments on March 17, 2016, 2017,16, 2018 and 2018.March 15, 2019. |
| |
| (3) | Performance Equity Awards are reflected at target. Actual vesting ranging from 0% to 200% of target will be determined three years after grant based upon the Company's cumulative Free Cash Flow per share against a target of $4.00. See "Compensation Discussion and Analysis" for further detail regarding the vesting of the Performance Equity Awards. |
| |
| (4) | Restricted stock vests in three equal installments on March 19, 2018, March 18, 2019, and March 15, 2020. |
| |
| (5) | TSR Equity Awards are reflected at target. Actual vesting ranging from 0% to 200% of target will be determined three years after grant based upon the Company's relative TSR performance against designated peer groups. See "Compensation Discussion and Analysis" for further detail regarding the vesting of the TSR Equity Awards. |
| |
(4)(6) | Restricted stock vests on March 17, 2016.19, 2018. |
| |
(5)(7) | Growth equity awards vest after a period of at least three years based on successful achievement of specified criteria and confirmation of a bring down calculation by the Compensation Committee. |
| |
(6) | Restricted stock vests in two equal installments on March 17, 2016 and 2017. |
| |
(7)(8) | As of March 15, 2016,17, 2018, such awards did not vest and have no value. |
| |
(8)(9) | Restricted stock vests (or vested) in four equal installments on March 17, 2016, 2017, 2018, 2019 and 2019.2020. |
The following table sets forth the option exercises and stock vesting for each of our named executive officers during the year ended December 31, 2015:2017:
Option Exercises and Stock Vested During 20152017
| | | | | Option Awards | | Stock Awards | | Option Awards | | Stock Awards |
| Name | | Number of Shares Acquired on Exercise (#) | | Value Realized on Exercise ($) | | Number of Shares Acquired on Vesting (#) | | Value Realized on Vesting (1) ($) | | Number of Shares Acquired on Exercise (#) | | Value Realized on Exercise ($) | | Number of Shares Acquired on Vesting (#) | | Value Realized on Vesting (1) ($) |
| Stephen J. Jones | | — |
| | $ | — |
| | — |
| | $ | — |
| | — |
| | $ | — |
| | 20,130 |
| | $ | 314,028 |
|
| Bradford J. Helgeson | | — |
| | $ | — |
| | 8,673 |
| | $ | 189,375 |
| | — |
| | $ | — |
| | 10,594 |
| | $ | 165,266 |
|
| Timothy J. Simpson | | | — |
| | $ | — |
| | 11,966 |
| | $ | 186,670 |
|
| Michael J. de Castro | | — |
| | $ | — |
| | — |
| | $ | — |
| | — |
| | $ | — |
| | 6,561 |
| | $ | 102,352 |
|
| Timothy J. Simpson | | — |
| | $ | — |
| | 11,315 |
| | $ | 247,063 |
| |
| Derek W. Veenhof | | — |
| | $ | — |
| | 7,130 |
| | $ | 155,684 |
| | — |
| | $ | — |
| | 10,760 |
| | $ | 167,856 |
|
| Matthew R. Mulcahy | | — |
| | $ | — |
| | 6,555 |
| | $ | 143,128 |
| |
| Anthony J. Orlando | | — |
| | $ | — |
| | 53,994 |
| | $ | 1,178,959 |
| |
| Seth Myones | | — |
| | $ | — |
| | 12,988 |
| | $ | 283,593 |
| |
We maintain a non-qualified supplemental defined benefit plan, relative to the Covanta Energy Pension Plan, a qualified defined benefit pension plan, prior to its termination in 2012. Historically, this non-qualified supplemental benefit provided a benefit equivalent to the Covanta Energy Pension Plan benefit for earnings above the IRS earnings cap. This non-qualified supplemental plan represents an unfunded obligation to pay a calculated benefit to participating employees as and when they would otherwise have been eligible to receive a benefit under the now-terminated Covanta Energy Pension Plan. Effective January 1, 2010, we amended our non-qualified supplemental benefit plan to exclude future compensation increases received by eligible participants after December 31, 2009.
In February 2010, we adopted the Severance Plan for Covanta Energy Corporation Senior Officers, referred to in this proxy statement as the “Severance Plan.” This plan covers our Chief Executive Officer, Executive Vice Presidents, Regional Vice-Presidents, Senior Vice-Presidents, Chief Accounting Officer and Treasurer.
Change in control arrangements are also covered in the Covanta Holding Corporation Restricted Stock Award Agreement, referred to in this proxy statement as the “Restricted Stock Award Agreement,” the Growth Equity Award Agreement, and the TSR Equity Award Agreement.
For purposes of the Severance Plan, the Restricted Stock Award Agreement, the Growth Equity Award Agreement, and the TSR Equity Award Agreement and the Performance Equity Award Agreement executed in connection with the award of restricted stock and restricted stock units under the 2014 Equity Plan, the terms “cause,” “change in control,” and “eligible termination of employment” are defined as follows:
“Change in Control” shall mean the occurrence of any of the following events, each of which shall be determined independently of the others:
(a) any “Person”, other than a holder of at least 10% of our outstanding voting power as of the date of this agreement or plan, becomes a “beneficial owner” (as such term is used in Rule 13d-3 promulgated under the Securities Exchange Act of 1934, as amended) of a majority of our stock entitled to vote in the election of our directors or the directors or the directors of our subsidiaries;
(b) individuals who are our “Continuing Directors” of Covanta cease to constitute a majority of the members of the Board. For purposes of this definition, “Continuing Directors” shall mean the members of the Board on the date of the agreement or plan, as applicable, provided that any person becoming a member of the Board subsequent to such date whose election or nomination for election was supported by at least a majority of the directors who then comprised the Continuing Directors shall be considered to be a Continuing Director;
(c) our stockholders adopt and consummate a plan of complete or substantial liquidation or an agreement providing for the distribution of all or substantially all of our assets or the assets of our subsidiaries;
(f) Covanta consummates a transaction which constitutes a “Rule 13e-3 transaction” (as such term is defined in Rule 13e-3 of the Exchange Act) prior to the termination of the agreement or plan, as applicable.
“Eligible Termination of Employment” shall mean the involuntary termination other than for Cause of an Employee's employment with the Company Group after the Effective Date.